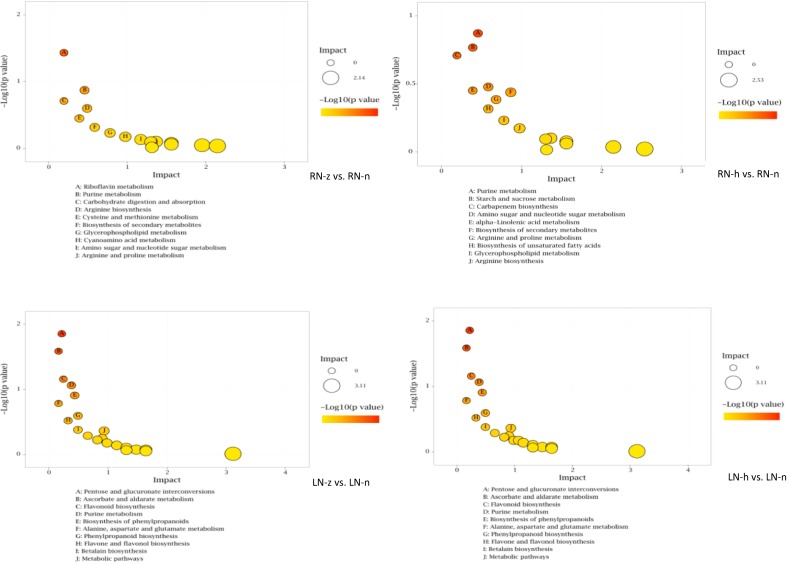
Fig. 3.
The bubble plots of differential metabolic pathway in nitrogen deficiency. Each bubble represents a metabolic pathway respectively, the abscissa and the size of the bubble indicates the size of the influence factor of the pathway in the topological analysis; the larger the size, the larger the influence facto. The ordinate of the bubble and the bubble color indicated the p value (take negative natural logarithm, lnp-value) in the enrichment analysis, the deeper the color, the smaller the p value, and the more significant the enrichment.

