
Fig. 2.
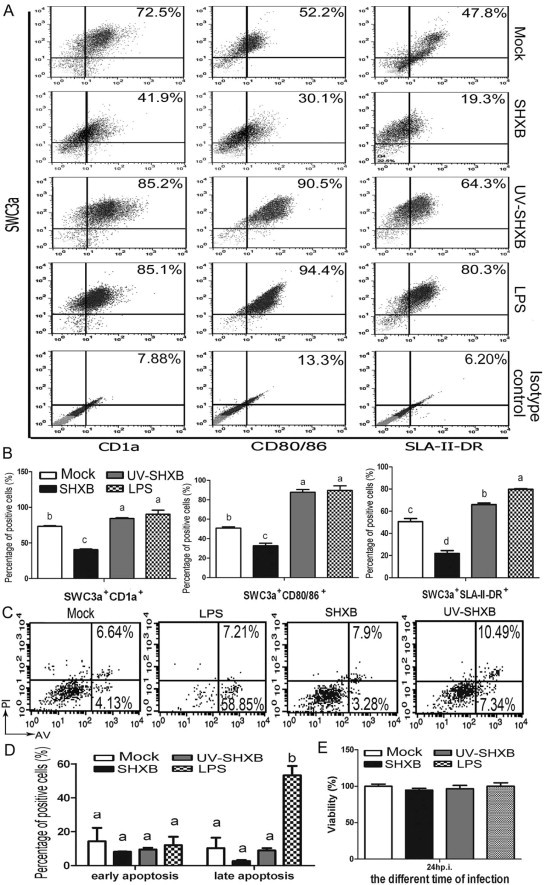
Expression of CD1a+ SWC3a+, CD80/86+ SWC3a+and SLA-II-DR+ SWC3a+ by immature Mo-DCs infected with virulent SHXB and UV-SHXB at 24 h p.i. and the apoptosis and viability of immature Mo-DCs infected with the SHXB and UV-SHXB at 24 h p.i. (A) Dot plots show the percentage of CD1a+ SWC3a+, CD80/86+ SWC3a+ and SLA-II-DR+ SWC3a+ Mo-DCs in the immature Mo-DCs infected with virulent SHXB and UV-SHXB among the total Mo-DCs at 24 h p.i. (B) Bar graphs show the number of CD1a+ SWC3a+, CD80/86+ SWC3a+ and SLA-II-DR+ SWC3a+ in the immature Mo-DCs infected with SHXB and UV-SHXB. Data express the mean ± SEM from three independent experiments. Bars labelled with different letters are significantly different from each other (P < 0.05). (C) Dot plots and (D) bar graphs both show the percentage of apoptotic immature Mo-DCs treated with the SHXB and UV-inactivated SHXB at 24 h p.i. Data express the mean ± SEM from three independent experiments. Bars labelled with different letters are significantly different from each other (P < 0.05). (E) Bar graphs show the viability of the immature Mo-DCs infected with SHXB and UV-SHXB. Data express the mean ± SEM from three independent experiments. Bars not labelled with letters are not significantly different from each other (P > 0.05).