
Supplementary Fig. 2.
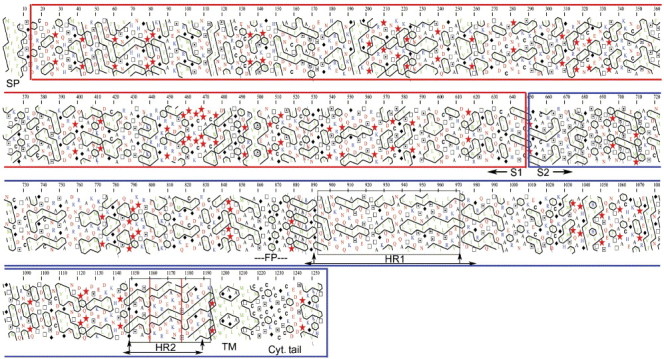
Hydrophobic Cluster Analysis. Hydrophobic Cluster Analysis (Gaboriaud, 1987) Plot for HR1 and TM regions (A) and HR2, TM and cytoplasmic tail (B).
Official websites use .gov
A
.gov website belongs to an official
government organization in the United States.
Secure .gov websites use HTTPS
A lock (
) or https:// means you've safely
connected to the .gov website. Share sensitive
information only on official, secure websites.
Hydrophobic Cluster Analysis. Hydrophobic Cluster Analysis (Gaboriaud, 1987) Plot for HR1 and TM regions (A) and HR2, TM and cytoplasmic tail (B).