
Fig. 4.
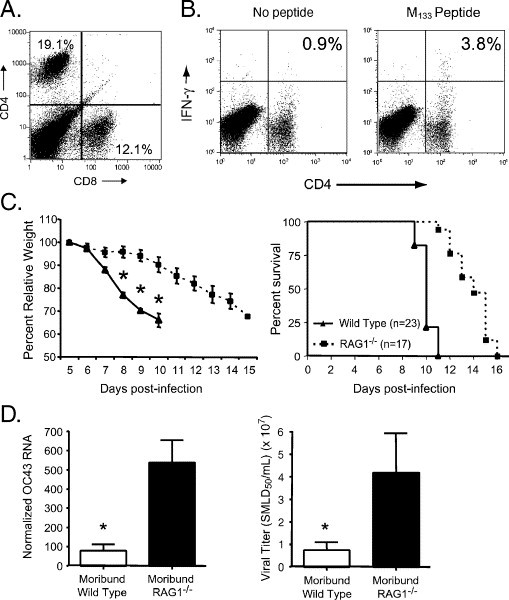
T cell infiltration into the HCoV-OC43NV-infected CNS contributes to morbidity and mortality. (A) Both CD4 and CD8 T cells infiltrate the brains of HCoV-OC43NV-infected mice. Mononuclear cells were harvested 7 days p.i., surface stained for CD4 and CD8 and subjected to FACS analysis as described in Materials and methods. Data from one representative mouse are shown. (B) Two color FACS analysis of in vitro peptide-stimulated mononuclear cells demonstrating infiltration of OC43-specific CD4 T cells. Whole brains were isolated from HCoV-OC43NV-infected mice 7 days p.i. Mononuclear cells were surface stained for CD4 and intracellularly stained for IFN-γ ex vivo after no stimulation (left panel) or stimulation with M133 peptide (right panel). Data from one representative mouse are shown. (C) HCoV-OC43NV-infected RAG1−/− C57BL/6 mice lose weight (left panel) and succumb to infection (right panel) with delayed kinetics relative to infected wild type mice (*Indicates P < 0.05). (D) Relative burden of HCoV-OC43 RNA (left panel) and infectious virus (right panel) in brains of moribund wild type and RAG1−/− mice. Data in panel C are expressed as mean ± SEM for 4–6 mice per group. (*Indicates P < 0.05).