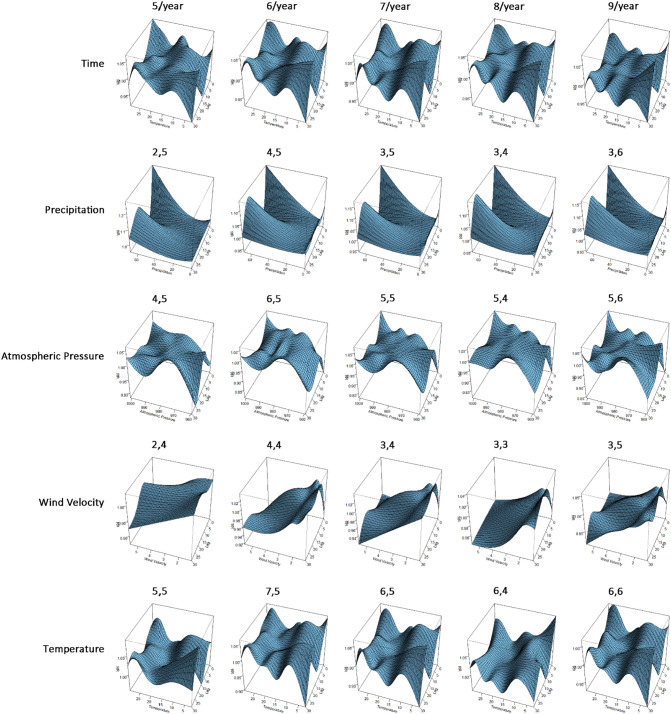
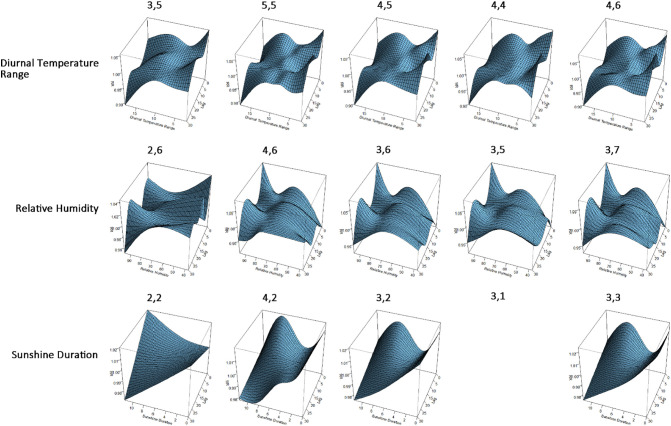
Fig. A.2.
Results of sensitive analysis by changing the degree of freedom of long-term trend and seasonality and changing the degrees of freedom of meteorological factors and corresponding lags. The parameters above each 3D plot mean the degrees of freedom used in DLNM. The 3D plot in the middle of each line represents the result of main model and the rest represent the result of alternative model. There is a vacancy for sunshine duration because the model is invalid when the degree of freedom is 1.


