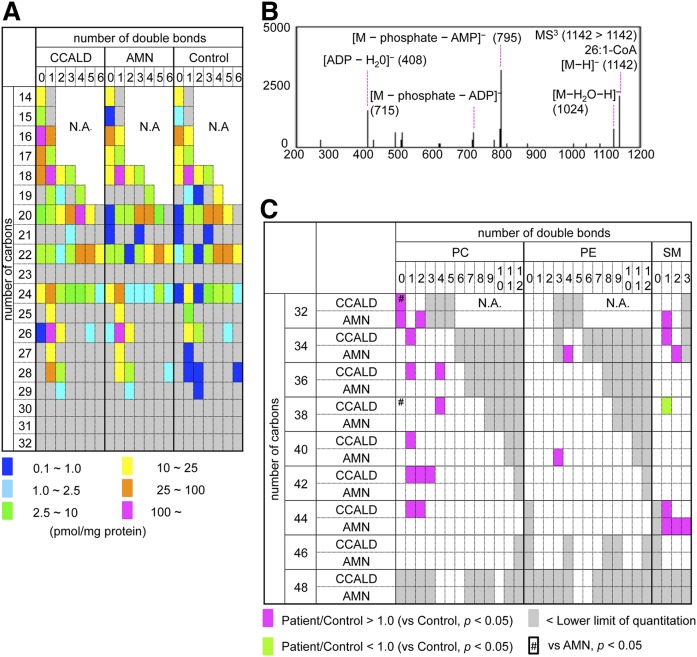
Fig. 2.
Quantity of each acyl-CoA species in the X-ALD fibroblasts. A: Each acyl-CoA species in fibroblasts from four CCALD, three AMN, and five control patients was quantified in the positive ion mode, and was classified according to the number of carbons and double bonds in the acyl moiety. The ratio of peak area for each acyl-CoA/D31-16:0-CoA was used to calculate the amount of each acyl-CoA species, and the mean quantity of each acyl-CoA species in the X-ALD fibroblasts is represented with a color key. The data are also summarized in Table 2. Acyl-CoA species observed to be present below the quantitation range are indicated in gray. B: The product ion spectra of 26:1-CoA corresponding to [M–H]− (m/z = 1,142) in LC-MS3 analysis. Structural analysis was performed in the negative ion mode. C: Each PC, PE, and SM species present in quantities significantly higher (magenta) or lower (lime) in X-ALD fibroblast samples (CCALD or AMN) relative to the control fibroblasts was classified according to the number of carbons and double bonds in the two acyl moieties. The PL species present in quantities significantly altered in CCALD fibroblasts relative to the AMN fibroblasts are indicated as #. The PL species observed to be present in quantities below the quantitation range are indicated in gray. Acyl-CoA species for which the MRM channels were not designed are indicated as N.A. The quantity of each PL species in the X-ALD fibroblasts is listed in supplemental Table S1

