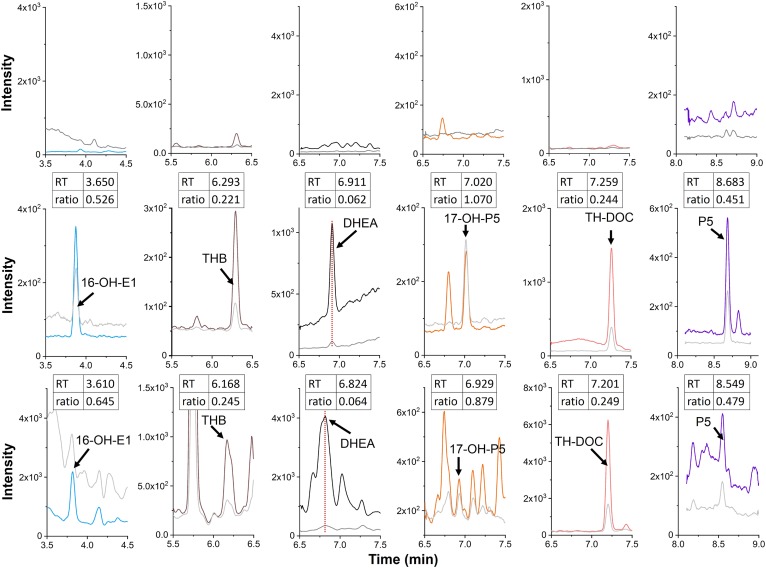
Fig. 6.
MRM chromatograms of steroids from a charcoal-treated blank matrix sample (upper), a charcoal-treated spiked sample (middle), and a whole mouse brain (lower). Each steroid was identified using two MRM transitions (supplemental Table S1). The colored traces in each chromatogram are depicted with the values (= transitions) in bold in supplemental Table S1, which were used for the quantification (16-OH-E1, m/z 293.2→79.1; THB, m/z 357.2→93; DHEA, m/z 295.2→277.2; 17-OH-P5, m/z 339.2→93.1; TH-DOC, m/z 341.2→93; and P5, m/z 323.2→43.1). The gray traces represent the transitions used for the qualification in supplemental Table S1 (16-OH-E1, m/z 293.2→275.2; THB, m/z 357.2→107.1; DHEA, m/z 295.2→105.1; 17-OH-P5, m/z 339.2→81.1; TH-DOC, m/z 341.2→107; and P5, m/z 323.2→105.1). The amounts of steroids spiked to the charcoal-treated sample were 50 pg for 16-OH-E1, THB, and TH-DOC, and 500 pg for DHEA, 17-OH-P5, and P5. The ratios indicated in the insets were calculated on the basis of the peak height ratios of the two transitions (normal over bold values, obtained for each steroid, in supplemental Table S1).

