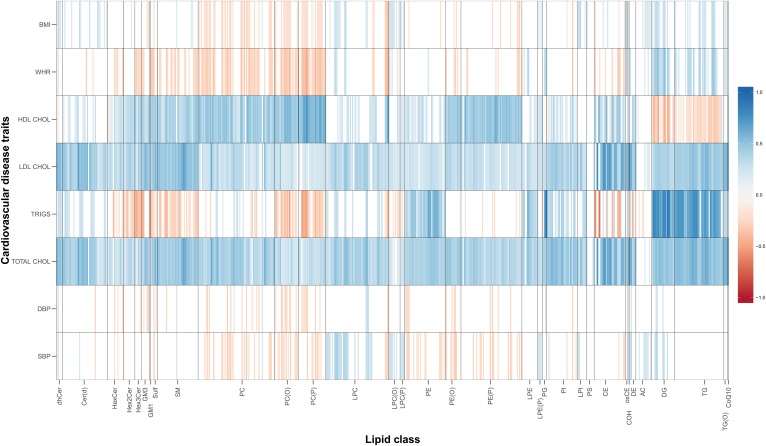
Fig. 4.
Heat map of genetic correlations between lipid species and CVD traits. Red, negative genetic correlation; blue, positive genetic correlation. Only genetic correlations that are different from zero at a false discovery rate (FDR) of 0.05 are shown in the plot. Full genetic correlation estimates are shown in supplemental Table S3. For lipids and cardiovascular risk factors, please refer to abbreviations used in Figs. 1 and 3.

