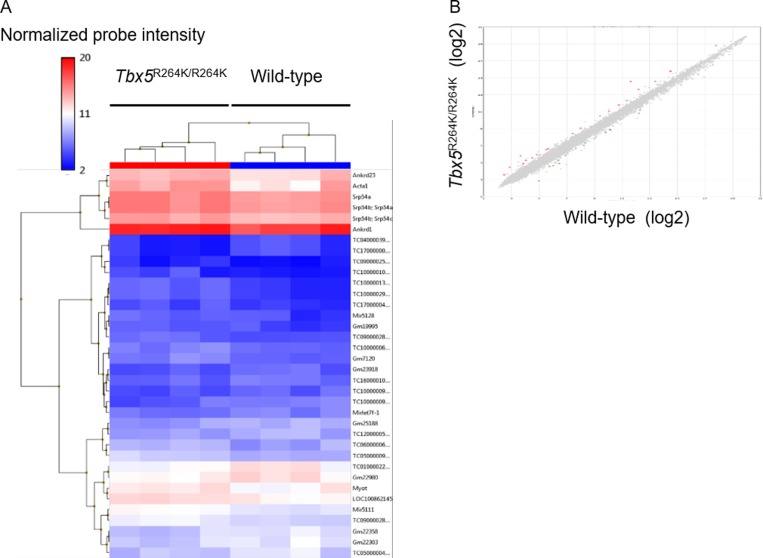
Fig 2. Microarray analysis of RNAs isolated from the left ventricle myocardium of young adult Tbx5R264K/R264K mice compared with wild-type.
A Clustering map shows 36 RNAs were significantly (P value <0.05) changed with greater than 2.0 or less than -2.0 fold expression changes. B Scatter plot shows those 36 RNAs indicated as red (increased) and blue (decreased) points.

