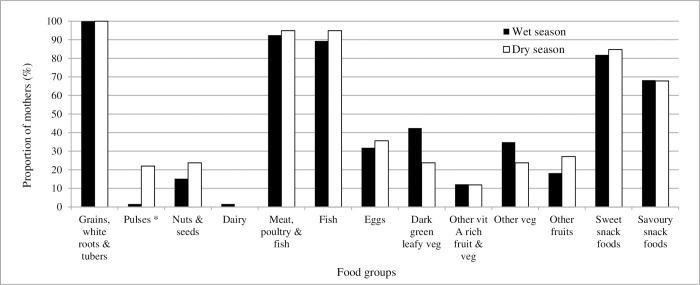
Fig 1. Proportion of mothers consuming different food groups during the wet and dry seasons.
Fig 1 shows the proportion of mothers who reported consuming foods within different food groups in the preceding 24-hour period. Consumption of fish is reported within the food group ‘meat, poultry and fish’ and as in individual food; consumption of sweet and savoury snack foods are not included in the dietary diversity indicator score, but are included to show dietary pattern. * indicates a statistically significant difference in seasonal consumption.

