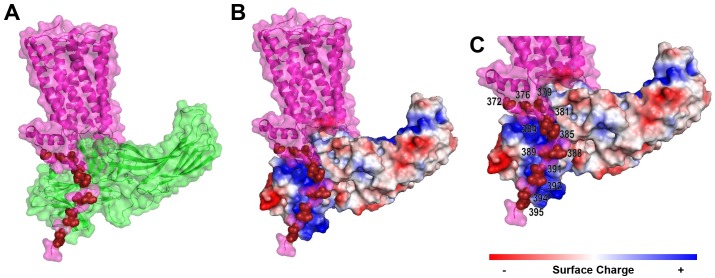
Fig 8. Structural modelling of the melanopsin—β-arrestin-1 complex highlights the importance of proximal C-terminus phosphorylation sites.
(A) Melanopsin (pink) in complex with β-arrestin 1 (green). Proximal C-terminus phosphorylation sites are indicated in dark red. (B) Melanopsin (pink) in complex with β-arrestin 1, which has surface charge indicated by red, blue, or white. Proximal C-terminus phosphorylation sites indicated by light blue spheres. (C) Zoomed in view of (B), with phosphorylation sites numbered.

