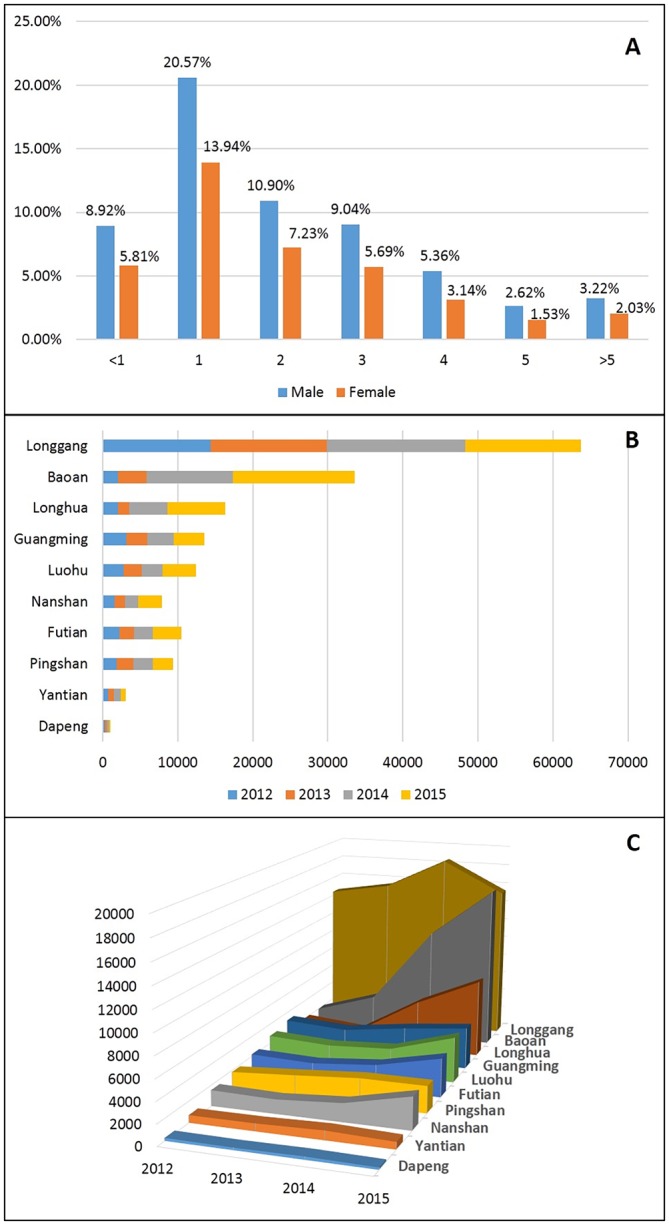
Fig 2. The statistical graph of the reported HFMD cases in Shenzhen, from 2012 to 2015.

The characteristics distribution of age groups and sex, from 2012 to 2015(Fig.2.A). The distribution of the number of cases of each district from 2012 to 2015(Fig.2.B). The trends in the number of cases of each district from 2012 to 2015(Fig.2.C).
