
Figure 7.
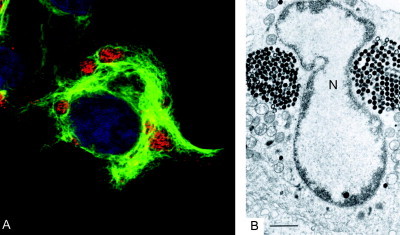
(A) Confocal micrograph of frog virus 3‐infected cell showing relationship between the major capsid protein (red), vimentin (green), and DNA (blue). Note multiple viral inclusions in the cytoplasm, each associated with an individual vimentin cage. Authors own. (B) Electron micrograph of a frog virus 3‐infected cell showing two crystalline arrays that appear to induce a kidney‐shaped nucleus (N). Reprinted from Darlington et al. (1966) with permission from Elsevier.