
Fig. 28.
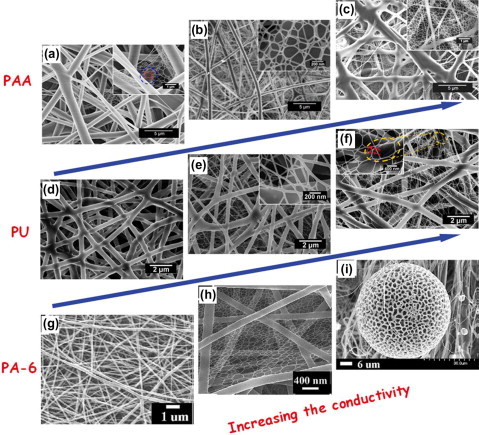
Effect of salt concentration on the morphology of fibrous membranes. (a–c) FE-SEM images of PAA/NaCl NFN membranes formed with different NaCl concentrations: (a) 0 (pristine PAA), (b) 0.1, and (c) 0.2 wt%. Reprinted with permission from [31]. © 2011 Royal Society of Chemistry. (d–f) FE-SEM images of PU/NaCl NFN membranes formed with different NaCl concentrations: (d) 0 (pristine PU), (e) 0.05, and (f) 0.1 wt%. Reprinted with permission from [30]. © 2011 WILEY-VCH Verlag GmbH & Co. (g–i) FE-SEM images of PA-6/NaCl NFN membranes formed with different NaCl concentrations: (g) 0 (pristine PA-6), (h) 1.5, and (i) 2.5 wt%. Reprinted with permission from [34]. © 2009 Elsevier B.V.