
Fig. 31.
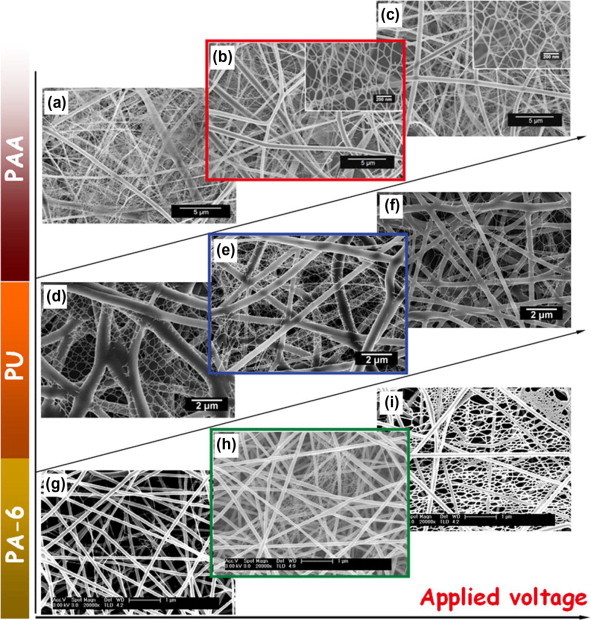
Effect of applied voltage on the morphology of (a-c) PAA/NaCl, (d–f) PU/NaCl and (g–i) PA-6 NFN membranes. FE-SEM images of PAA/NaCl NFN membranes obtained at different voltages: (a) 30, (b) 40, and (c) 50 kV. Reprinted with permission from [31]. © 2011 Royal Society of Chemistry. FE-SEM images of PU/NaCl NFN membranes obtained at different voltages: (d) 20, (e) 30, and (f) 40 kV. Reprinted with permission from [30]. © 2011 WILEY-VCH Verlag GmbH & Co. FE-SEM images of PA-6 NFN membranes obtained at different voltages: (g) 10, (h) 20, and (i) 30 kV. Reprinted with permission from [33]. © 2006 IOP Publishing Ltd.