
Fig. 32.
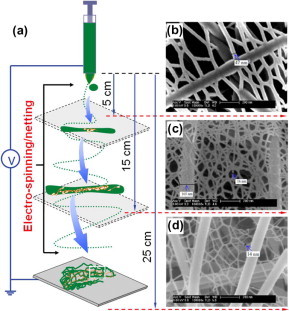
(a) Schematic diagrams illustrating the ESN process. SEM images of nylon-6 fibers formed with tip to collector distance of (b) 5, (c) 15, and (d) 20 cm. Reprinted with permission from [33]. © 2006 IOP Publishing Ltd.
Official websites use .gov
A
.gov website belongs to an official
government organization in the United States.
Secure .gov websites use HTTPS
A lock (
) or https:// means you've safely
connected to the .gov website. Share sensitive
information only on official, secure websites.
(a) Schematic diagrams illustrating the ESN process. SEM images of nylon-6 fibers formed with tip to collector distance of (b) 5, (c) 15, and (d) 20 cm. Reprinted with permission from [33]. © 2006 IOP Publishing Ltd.