
Figure 2.
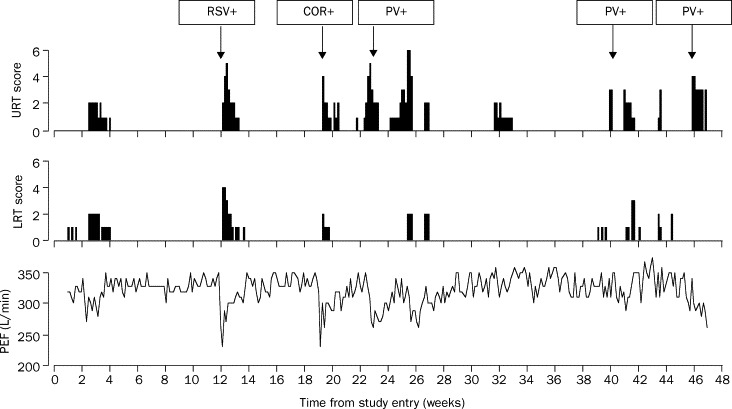
Upper and lower respiratory-tract symptoms and PEF rate in relation to virus detection
RT=upper respiratory tract. LRT=lower respiratory tract. PEF=peak expiratory flow. RSV=respiratory syncytial virus. PV=picornavirus. COR=coronavirus. Temporal relation between infection and symptom variables in one child are shown. Symptom scores are based on an arbitrary scale, and only symptoms recorded for 2 or more consecutive days are shown.