
Figure 4.
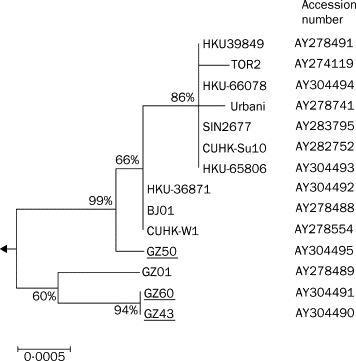
Phylogenetic analysis of nucleotide acid sequence of spike gene of SARS CoV viruses
Bootstrap values are shown as a percentage. The scale bar shows genetic distance estimated using Kimura's two parameter substitution model.14 The nucleotide sequences of representative SARS CoV S genes (S gene coding region residue, 3765 bp) were analysed. Viruses sequenced in this study are underlined, and the other sequences used in the analysis can be accessed in GenBank with accession numbers as shown.