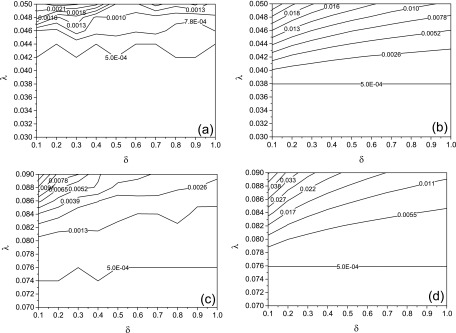
FIG. 1.
The contour plot of the maximal infection density , where the x coordinate is the response rate δ and the y coordinate is the spreading rate λ on a BA network with the mean degree (a) (b) and an ER network with (c) (d). Plots (a) and (c) denote the Monte Carlo simulations and plots (b) and (d) represent the Markov chain predictions (5). In all simulations the recover rate . The bottom line in each plot forms the boundary between the epidemic outbreak and the epidemic extinction.

