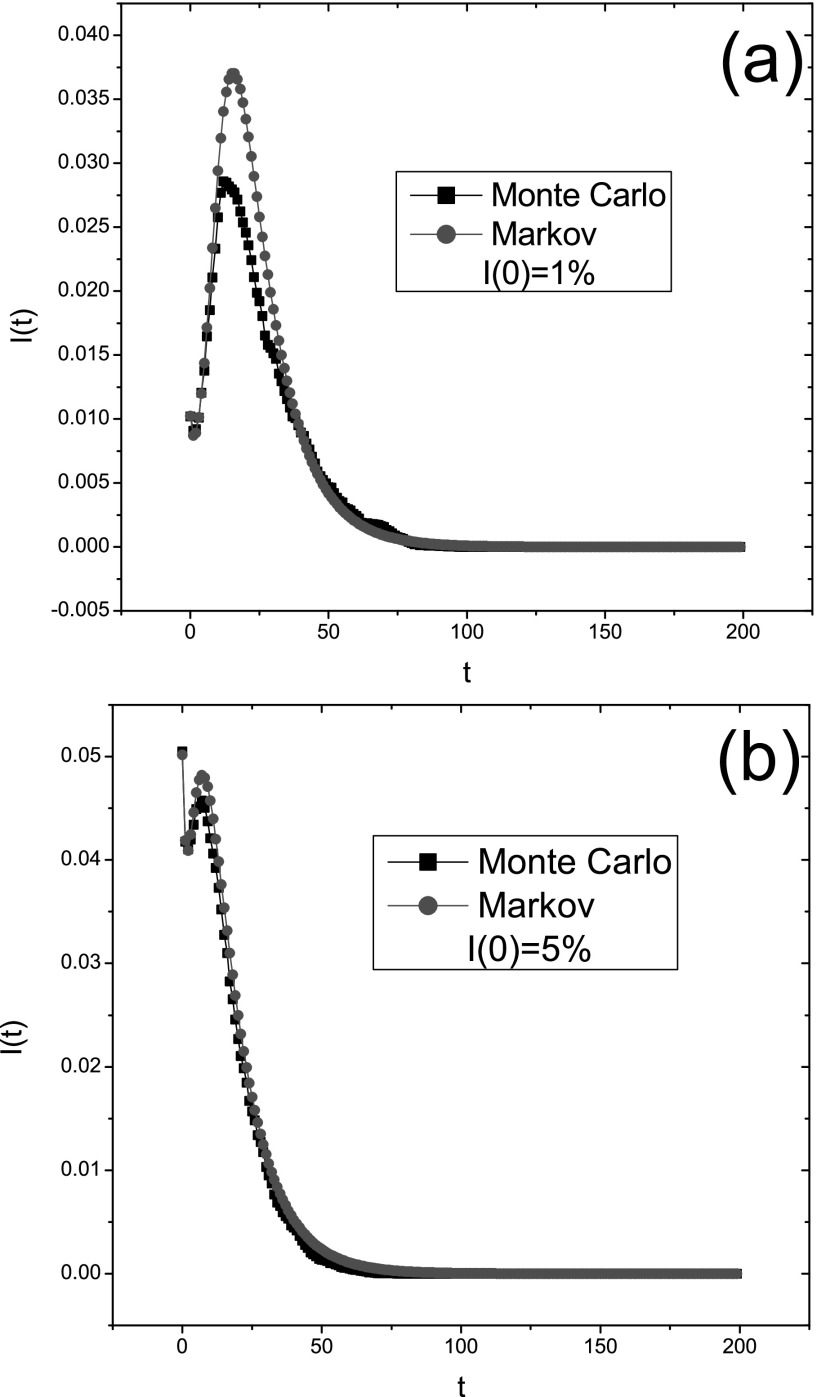
FIG. 6.
The fraction of infected nodes in a population I(t) as a function of time in the same BA scale-free network with N = 2000 for different initial infection conditions: (a) ; (b) . The simulation is obtained by taking the average over 100 epidemic dynamics. Other parameters: , and c = 30. This figure shows that the deviation between them can be reduced by increasing the initial infection density.

