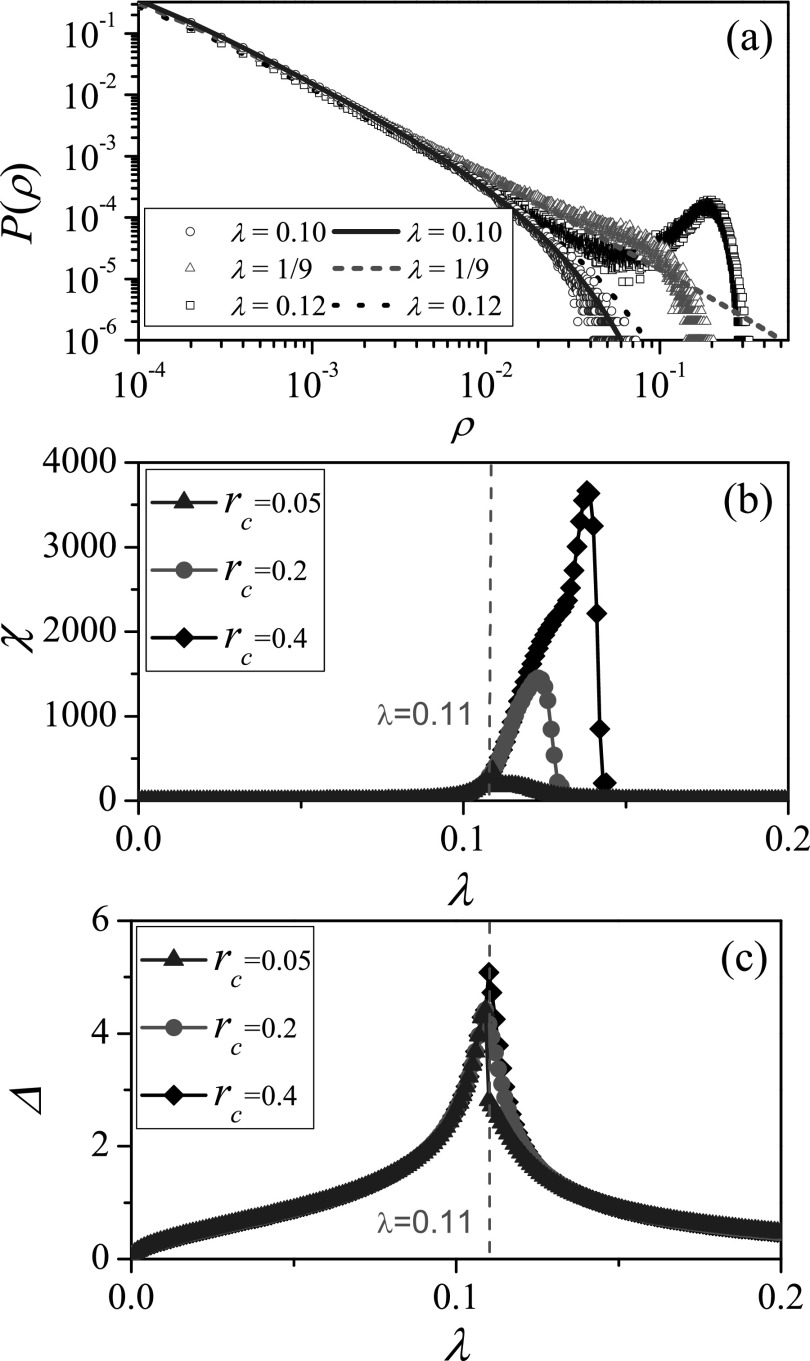
FIG. 2.
Analysis of effectiveness and robustness of numerical methods on RRN. (a) Numerical distribution of outbreak sizes in SIR model for (circles), (triangles), and (squares), where blue solid, red short dash, and black dot lines represent the theoretical distributions given by Eq. (A4). (b) χ vs. λ, where only the small outbreak sizes with are considered to numerically count χ. (c) Δ vs. λ, where the lump is assumed to be located at rc in the theoretical distribution diagram when . In (b) and (c), “triangles,” “circles,” and “diamonds” denote cutoff values rc = 0.05, 0.2 and 0.4, respectively. The parameters are chosen as and k = 10. The results are averaged over independent realizations on 102 networks.

