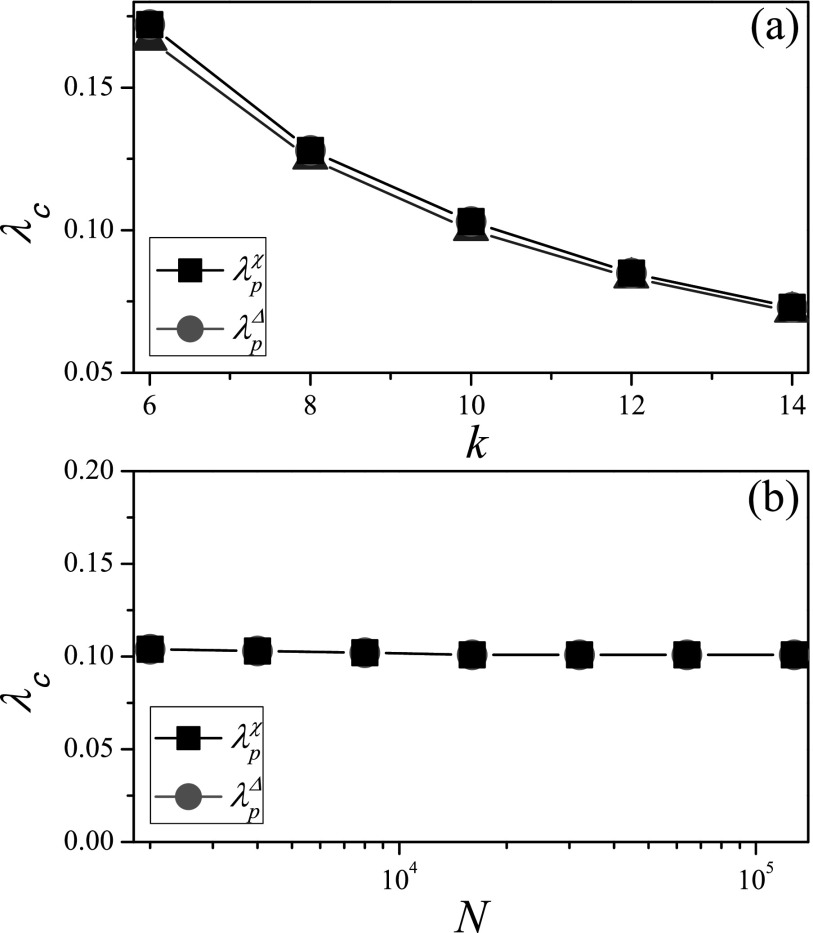
FIG. 6.
Comparison of theoretical thresholds with numerical thresholds for SIS model on RRN. (a) The threshold λc vs. k, where N is set to 104. (b) The threshold λc vs. N, where k is set to 10. “Squares” and “circles” denote and , respectively. The results are averaged over independent realizations on 102 networks.

