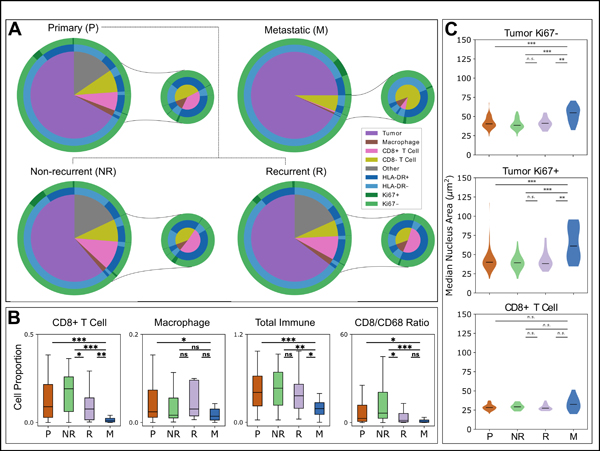
Figure 1. Comparison of cellular proportions and morphologies in primary and metastatic melanoma.

(A) All identified cells within the primary Mantra (n = 104) and metastatic (n = 14) cohorts, phenotyped via inForm. HLA-DR and Ki67 statuses are displayed, and proportions of phenotyped immune cells as a proportion of total cells as identified by DAPI are visualized in the smaller pies. The primary cohort is further distinguished into patients who were known to have recurrence (R, n = 16) or non-recurrence (NR, n = 36). (B) Comparison of cell proportions within the stromal compartments of tissue images, comparing all primary samples (P), known non-recurrent primaries (NR), recurrent primaries (R), and metastatic cases (M). “Total Immune” refers to the sum of all immune cells (CD3+ T cells and CD68+ macrophages), while CD8/CD68 ratio is the CD8+ T Cell (CTL) count divided by the CD68+ macrophage count. (C) Comparison of the sizes of nuclei within tumor Ki67-, tumor Ki67+, and CD8+ T cell populations between P, NR, R, and M patients. Statistical analyses performed using Mann-Whitney U test. ***, p<0.001; **, p<0.01; *, p<0.05; n.s., p≥0.05. Labels: all primary samples (P), known non-recurrent primaries (NR), recurrent primaries (R), and metastatic cases (M).
