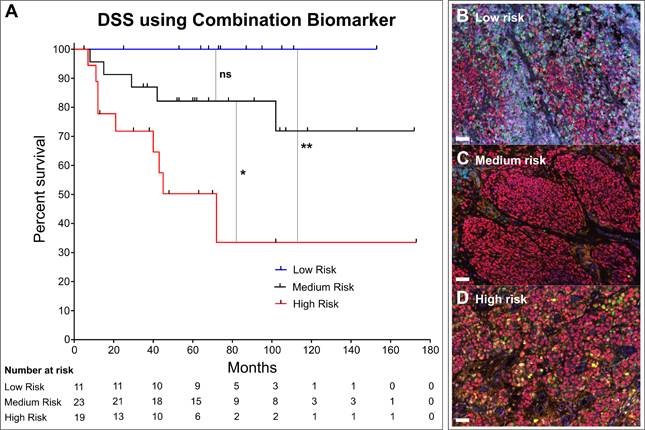
Figure 3. Combination of MIP and CD8/CD68 ratio predicts DSS.

(A) KM curve for disease specific survival (DSS) after patients stratified into high-risk (low MIP + low CD8/CD68 ratio), medium-risk (low MIP + high CD8/CD68 ratio), and low-risk (high MIP + high CD8/CD68 ratio), groups. Log-rank (Mantel-Cox) test used to compare low- and medium-risk patients (p=0.1228), low- to high-risk (p=0.0031) and medium- to high-risk (p=0.0258). Multiplex images stained for DAPI (nuclei, blue), SOX10 (tumor, red), CD3 (T cells, cyan), CD8 (CTLs, magenta), CD68 (Macrophages, green), Ki67 (proliferation marker, yellow), HLA-DR (activation marker, orange) in (B) patients in low-risk combination group, (C) patients in medium-risk combination group, and (D) patients in high-risk combination group.
