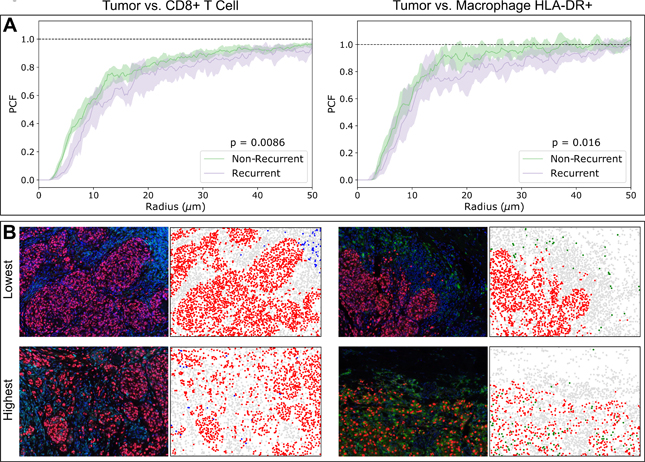
Figure 4. Pair correlation functions (PCF) reveal differences in clustering between tumor and immune cells.

(A) Non-recurrent patients have higher degrees of clustering between tumor cells and CTLs as well as with HLA-DR+ macrophages. Shaded regions indicate 95% confidence intervals of the median PCF obtained via bootstrapping. (B) Representative false-color images with the 3 lowest and 3 highest PCF values for each of the Tumor-CTL and Tumor Macrophage interactions. To the right of each image is a rendition of its cell segmentation, depicting Tumor (Red), CTL (Blue), Macrophage (Green), and Other (Gray). Statistical analysis performed using Mann-Whitney U test on PCF areas under the curve (AUC).
