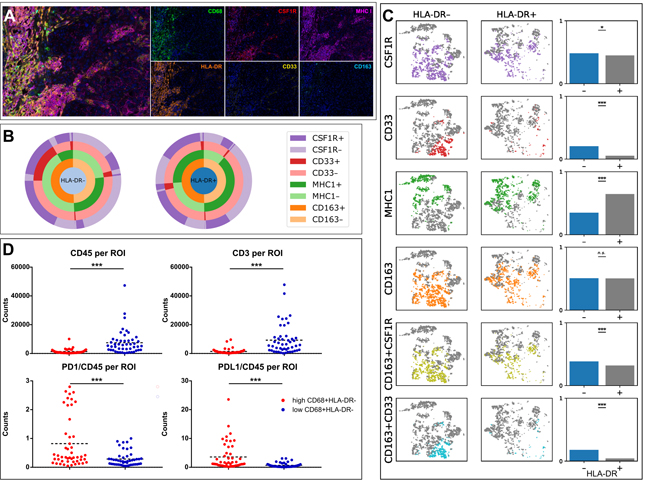
Figure 5. Investigation of macrophage subpopulations.

(A) Multiplex image of melanoma stained using qmIF for DAPI (blue), CD68 (green), HLA-DR (orange), CSF1R (red), CD163 (cyan), MHCI (magenta), and CD33 (yellow). (B) Macrophages were profiled for HLA-DR, CSF1R, CD33, MHC1, and CD163 expression in qmIF images obtained from 17 patients in the macrophage survey sub-cohort of primary melanomas. The pie charts assess the distribution of each marker within HLA-DR- and HLA-DR+ macrophage subpopulations. (C) T-distributed stochastic neighbor embedding (tSNE) was used to visually cluster macrophages based on the intensity values of all 5 profiled markers. Displayed are the subsets of this embedding that are HLA-DR- and HLA-DR+, and co-expression of each marker with HLA-DR is compared on the right. (D) Digital Spatial Profiling (DSP) analysis in 8 patients with primary melanoma from the DSP cohort. Displayed are plots showing CD45 and CD3 per region of interest (ROI) (top) and PD1 and PDL1 per CD45 comparing patients with high and low density of HLA-DR- macrophages. Statistical analysis performed using Chi squared test (C) or Mann-Whitney U test (D). ***, p<0.001; **, p< 0.01; *, p<0.05; n.s., p≥0.05.
