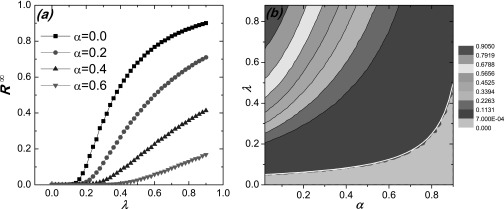
FIG. 4.
For SIR dynamics, effect of local behavioral response on epidemic prevalence and threshold: (a) epidemic prevalence R∞ as a function of transmission rate λ for different values of α; (b) contour of R∞ with respect to λ and α, where the white line is the prediction of Eq. (20). The gray region under the pink dash link indicates the epidemic prevalence . Since the number of the initial infected seeds is I0 = 5, we have for the steady state. Other parameters are the same as for Fig. 1.

