
Fig. 4.
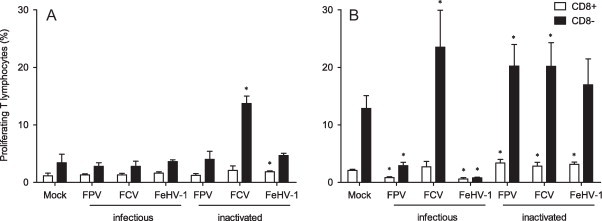
Percentage proliferating T lymphocytes in response to both infectious and inactivated feline panleukopenia virus (FPV), feline calicivirus (FCV), and felid herpes virus 1 (FeHV-1), using monocytes (A) and monocyte derived dendritic cells (B) as APC. Results are shown as mean ± SD (n = 3). Significant differences between mock-treated and virus-treated conditions (p ≤ 0.05) are indicated with an asterisk (*).