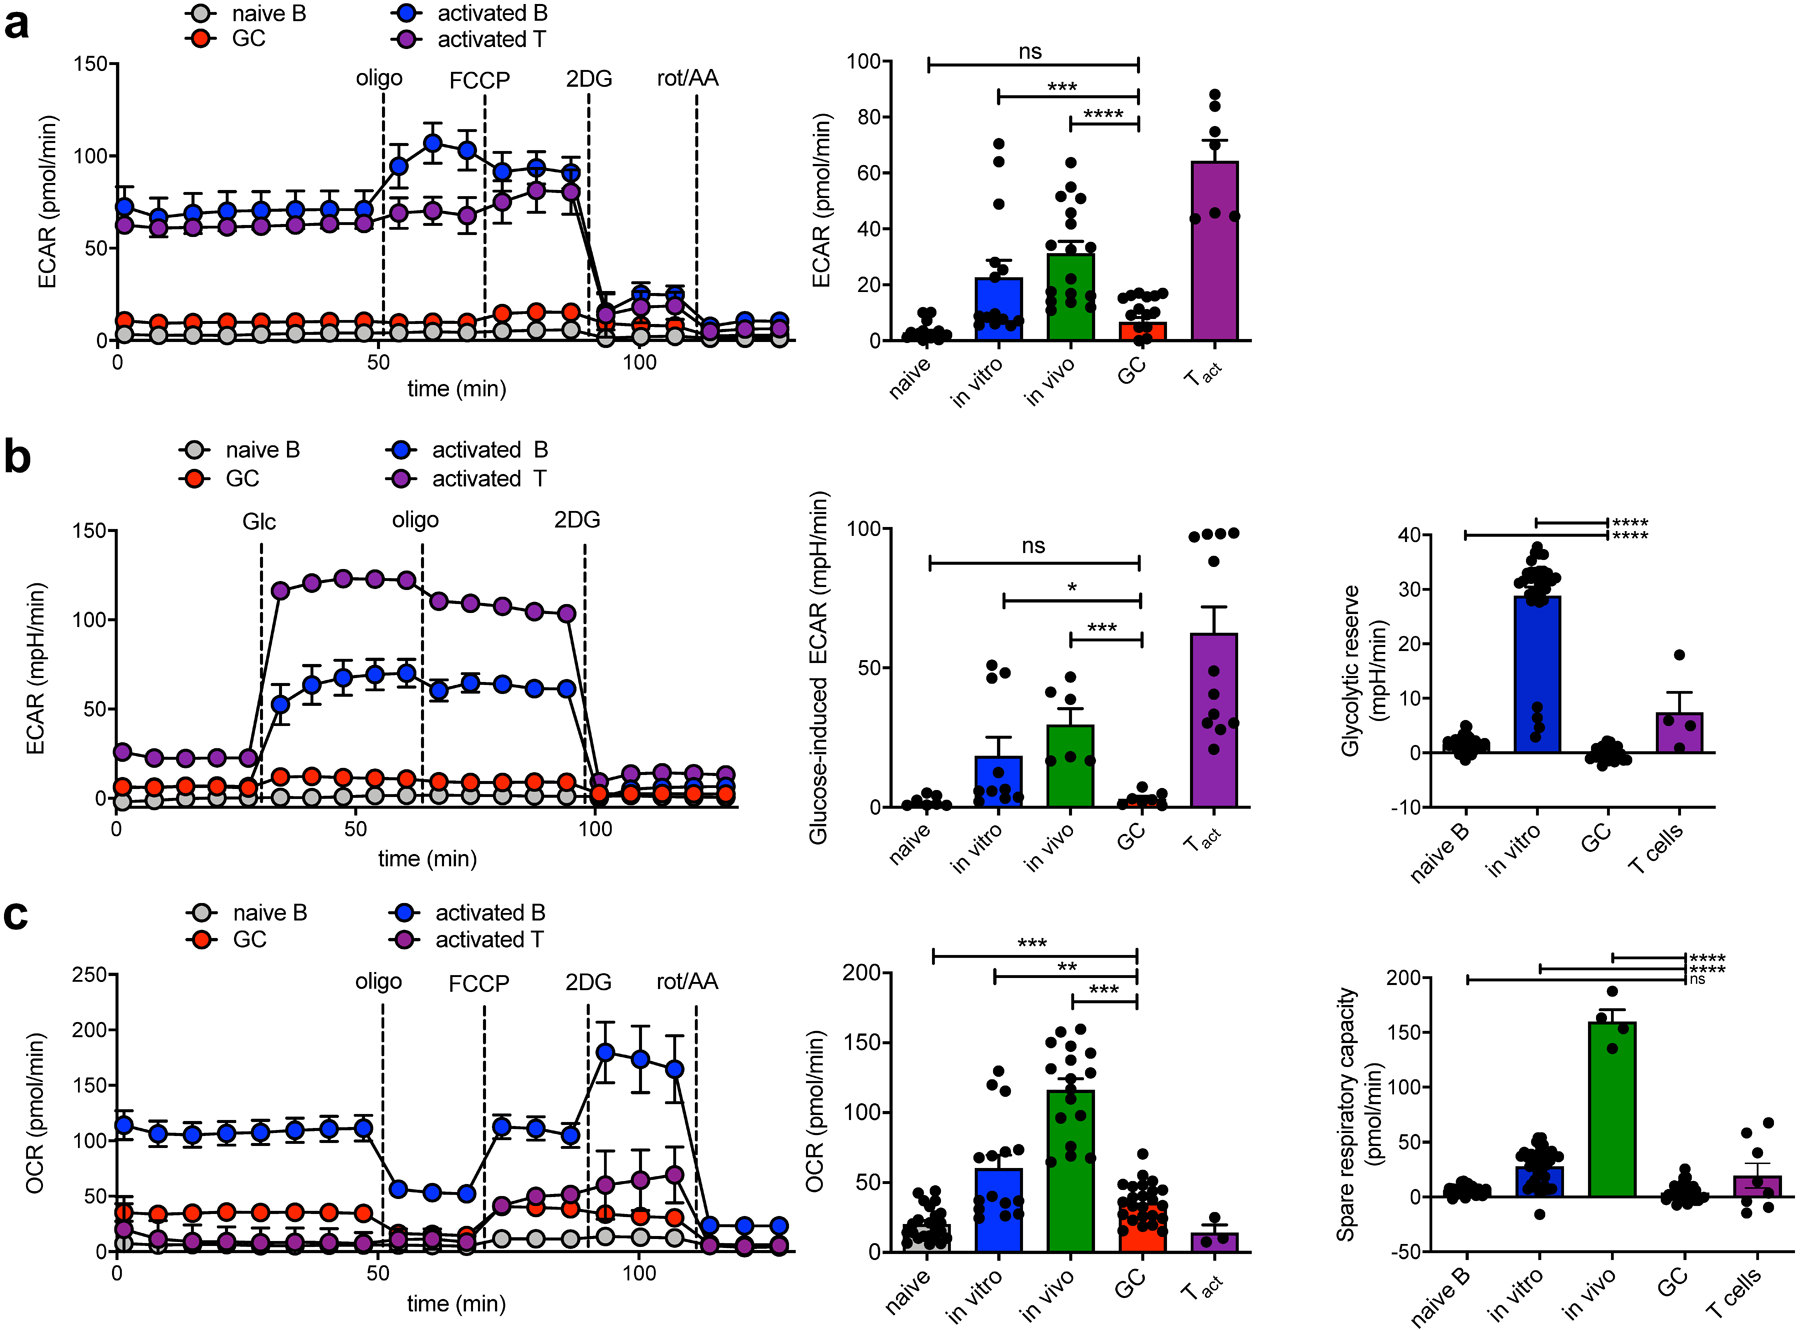
Fig. 1: GCBCs perform oxphos but not aerobic glycolysis.

a, Representative trace (left) and mean data (right) of extracellular acidification rate (ECAR). Values are averages of 5–8 basal ECAR measurements minus average of 3–5 ECAR readings after 2DG treatment of individual wells from indicated cell types subjected to a mitochondrial stress test in the Seahorse XFe96 flux analyzer. See Extended Data Fig. 1 for preparation of these cells. b, Representative trace (left) and mean data (center) of glycolytic ECAR when assayed in minimal media and treated with glucose in-Seahorse. Values are averages of 5 ECAR measurements after glucose stimulation minus averages of 5–8 basal ECAR readings of individual wells from indicated cell types. Glycolytic reserve (right) is the difference between glycolytic capacity and glycolysis rate and was measured as the difference between resulting ECAR values after in-Seahorse exposure to glucose and maximal ECAR values obtained after Oligomycin treatment. c, Representative trace (left) and mean data (center) of oxygen consumption rate from cells as in (a). Values are averages of 5–8 basal OCR measurements minus averages of 3–5 OCR readings after rot/AA treatment of individual wells from indicated cell types. Spare respiratory capacity is the difference between basal OCR values and maximal OCR values obtained after FCCP uncoupling (right). Results are representative of (for sample data) or represent the mean of 3–6 independent experiments. Bars represent mean +/− SEM; ns = not significant; *p ≤ 0.05; **p ≤ 0.01; ***p ≤ 0.001; ****p ≤ 0.0001 by unpaired, two-tailed t-test.
