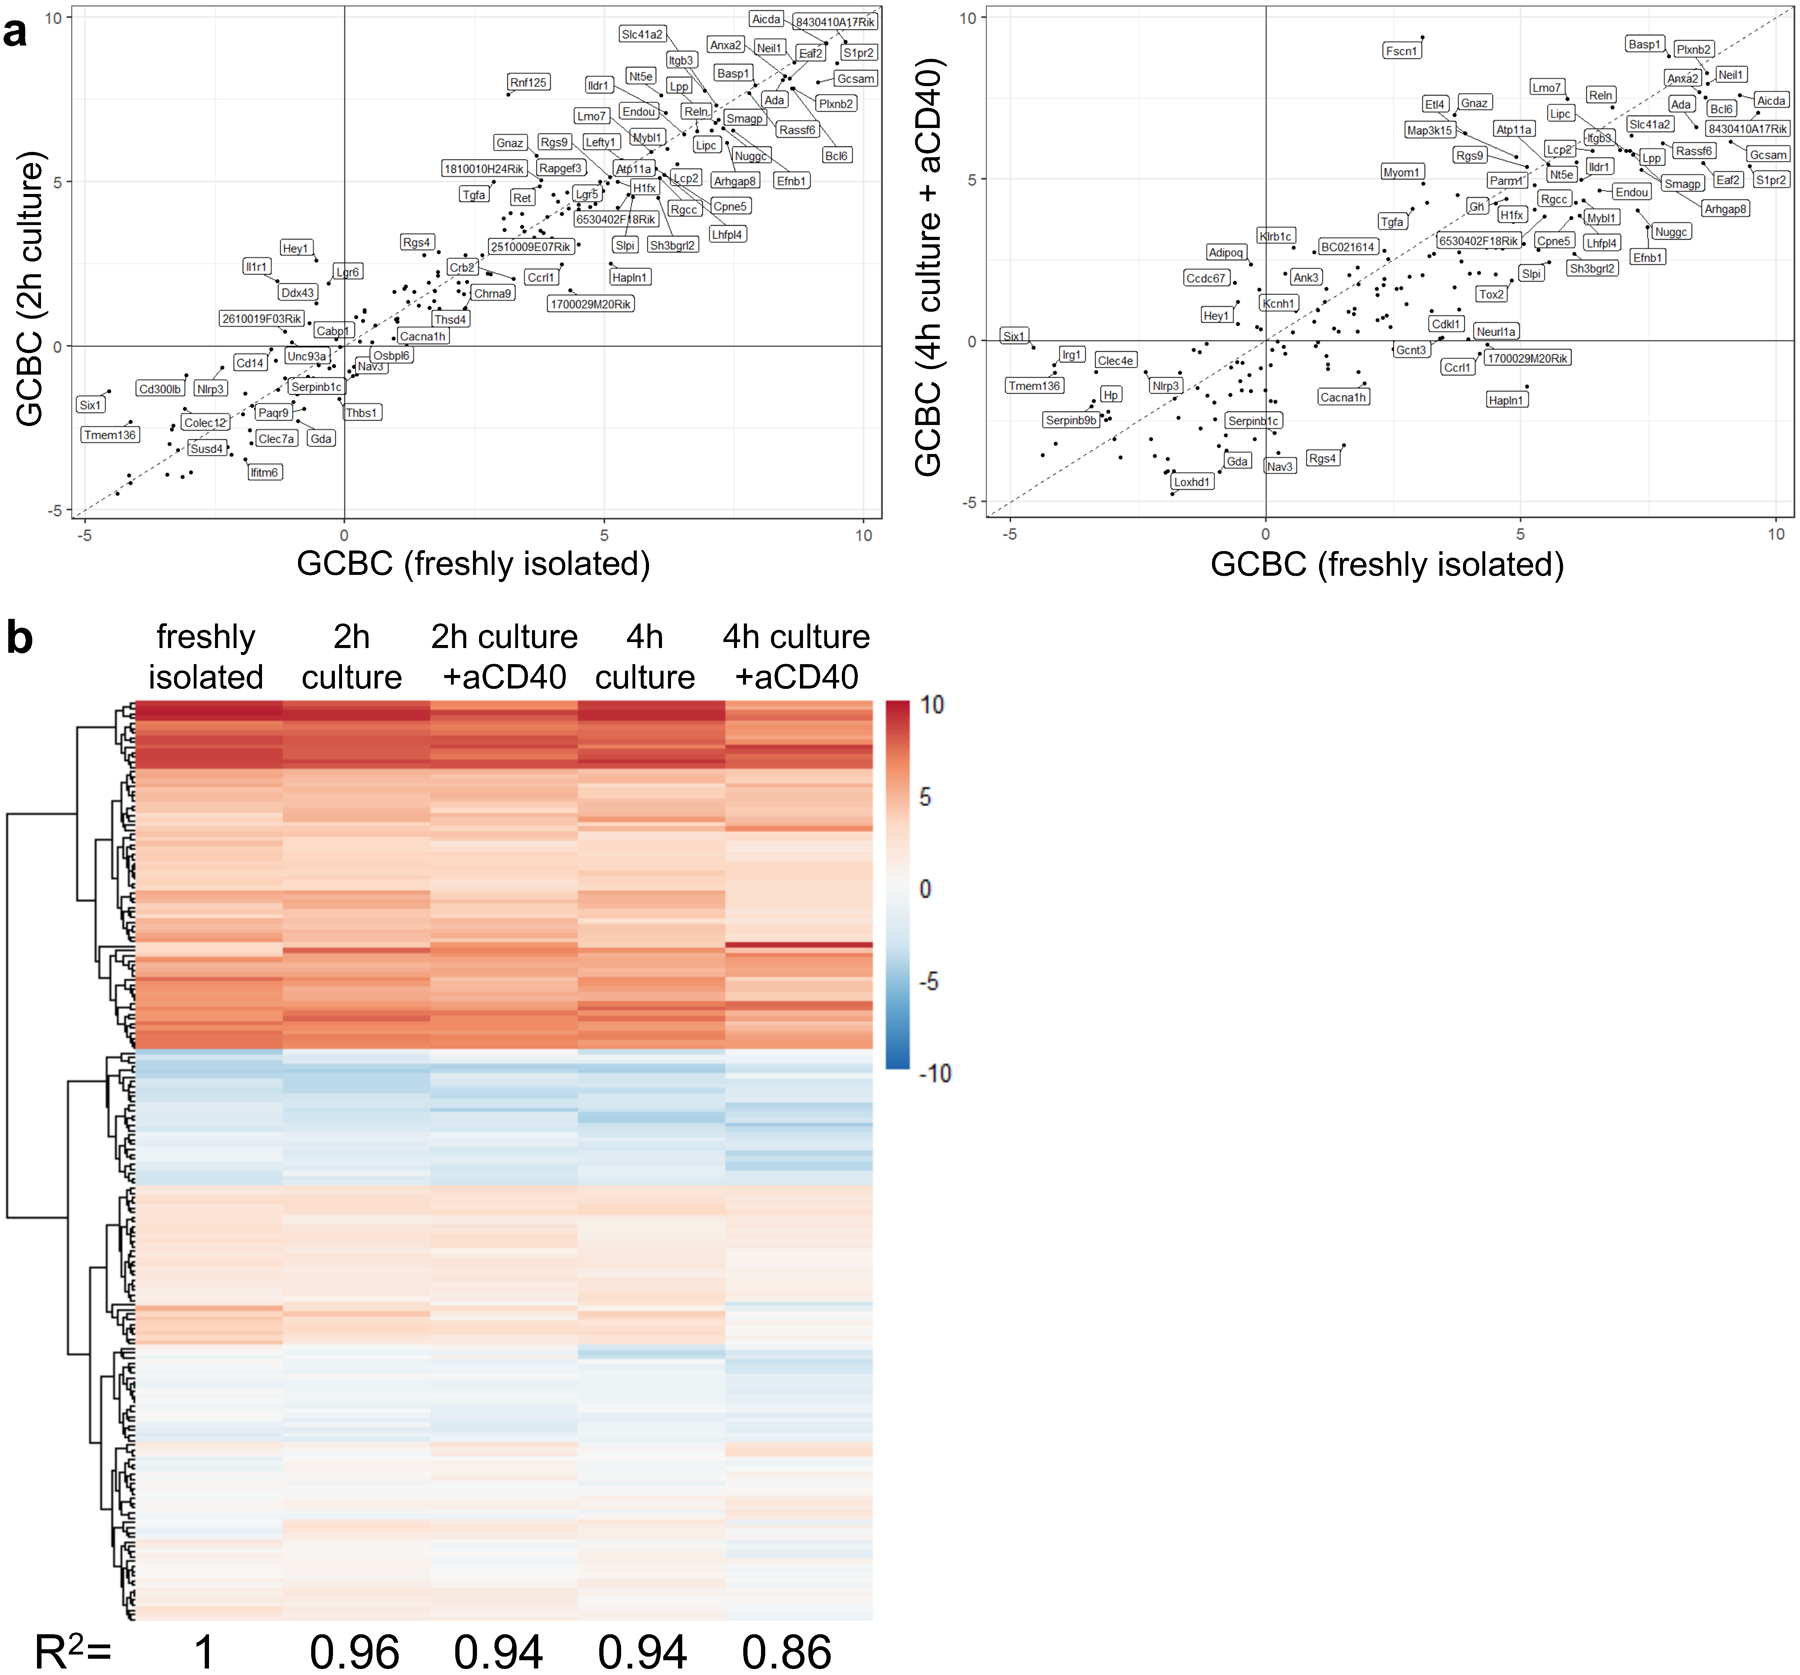
Extended Data Fig. 3. GCBC maintain key transcriptional profile during in vitro culture in support of figures 1, 2, 4, 5 and 6.

Comparison of transcriptional profile of 259 most differentially regulated GC genes. Genes shown are most differentially regulated between freshly isolated GCBC and in vivo activated B cells (FDR < 0.01; FC > 4 log2) and therefore serve as GCBC identifier geneset. a, correlation of GCBC identifier genes of freshly isolated GCBC and GCBC cultured for 2h (left; R2=0.96) which matches the conditions of seahorse experiments or GCBC cultured for 4h with aCD40 (right; R2=0.86) which matches our 13C tracing studies. b, heatmap of expression levels of 267 GCBC identifier genes in freshly isolated (left column) and cultured GCBC under depicted conditions. R-correlation of freshly isolated GCBC to all culture conditions is depicted below each column and was computed using R “cor” function with “pearson” method.
