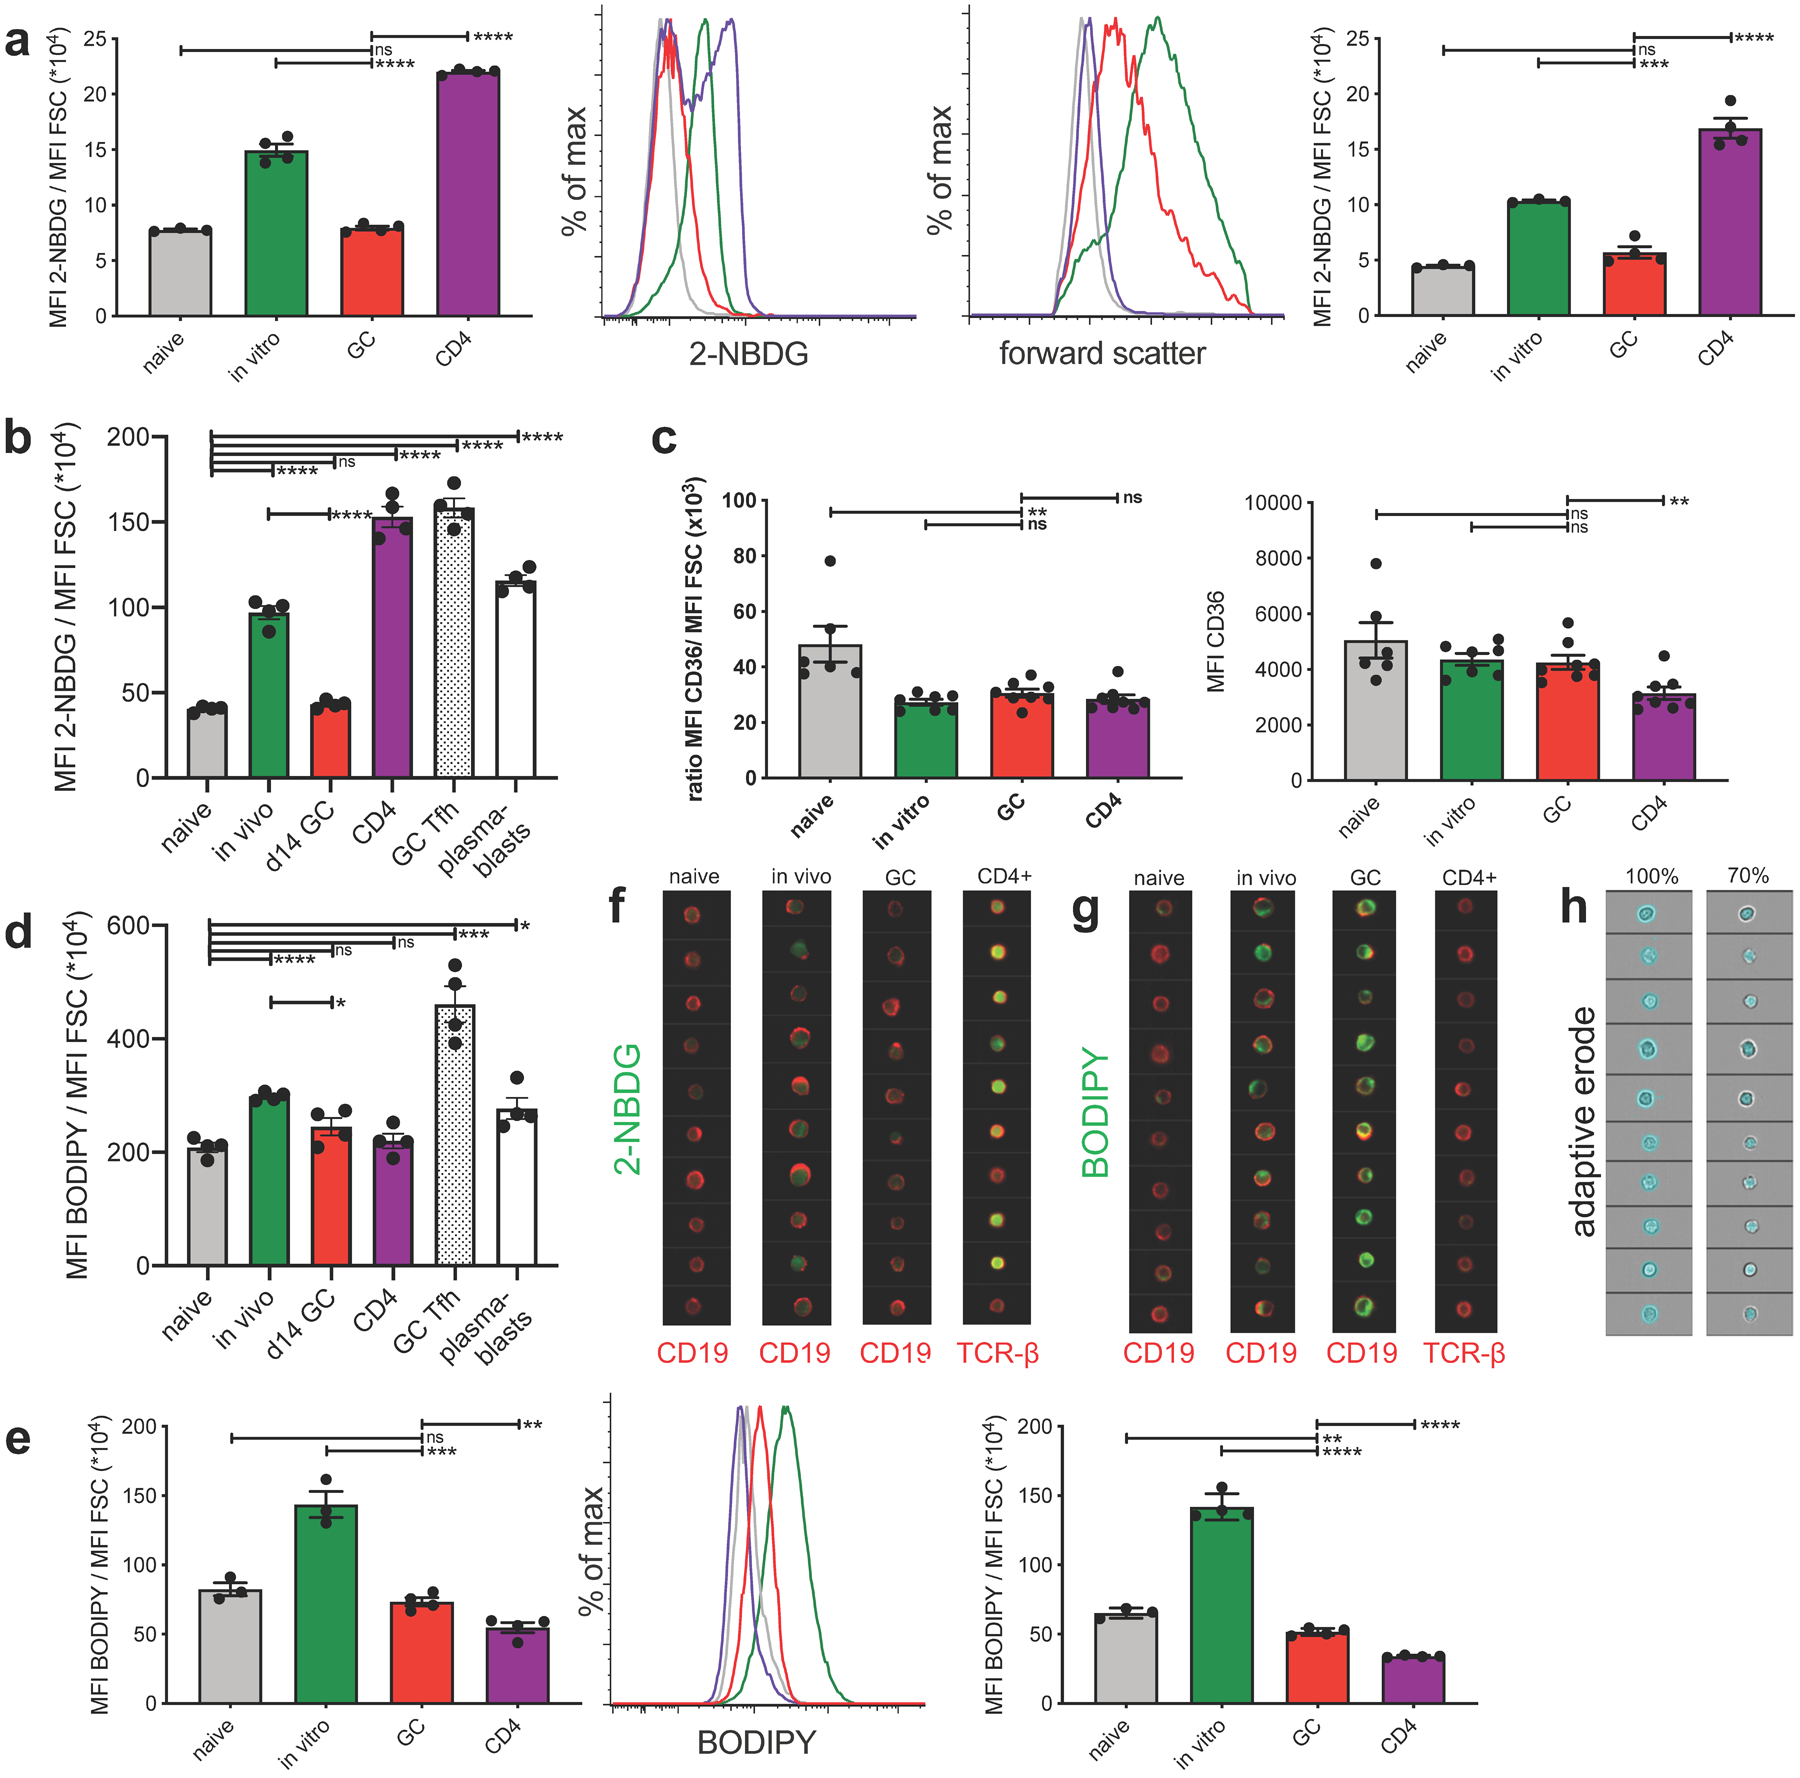
Extended Data Fig. 4. GCBC only take up minimal amounts of glucose but physiological amounts of FFA in support of figure 3.

a, tabulated data of mean 2-NBDG fluorescence normalized to cell size (left) and representative flow histograms of 2-NBDG fluorescence (center left) and forward scatter (center right) of indicated cell populations pulsed in vitro for 30 min with 2-NBDG. Right shows an independent repeat of left. b, independent repeat of data presented in Figure 3a. c, tabulated data of mean CD36 fluorescence normalized to cell size (left) and mean CD36 fluorescence of indicated cell populations. Shown are combined data of 2 independent experiments. d, independent repeat of data presented in Figure 3b. e, tabulated data of mean BODIPY fluorescence normalized to cell size (left) and representative flow histograms of BODIPY fluorescence (middle) of indicated cell populations, pulsed in vitro for 30min with BODIPY. Right panel shows an independent repeat of left panel. f and g, representative Amnis ImageStream images of cells presented in Fig. 3c and 3d, respectively. h, representative images of adaptive erode function for 100% (total cell, left) and 70% (intracellular, right). Fluorescence intensity is only calculated from areas colored in blue of the same cells shown in left and right panels. Bars represent mean +/− SEM; ns= not significant; *p ≤ 0.05; **p ≤ 0.01; ***p ≤ 0.001; ****p ≤ 0.0001 by unpaired, two-tailed t-test.
