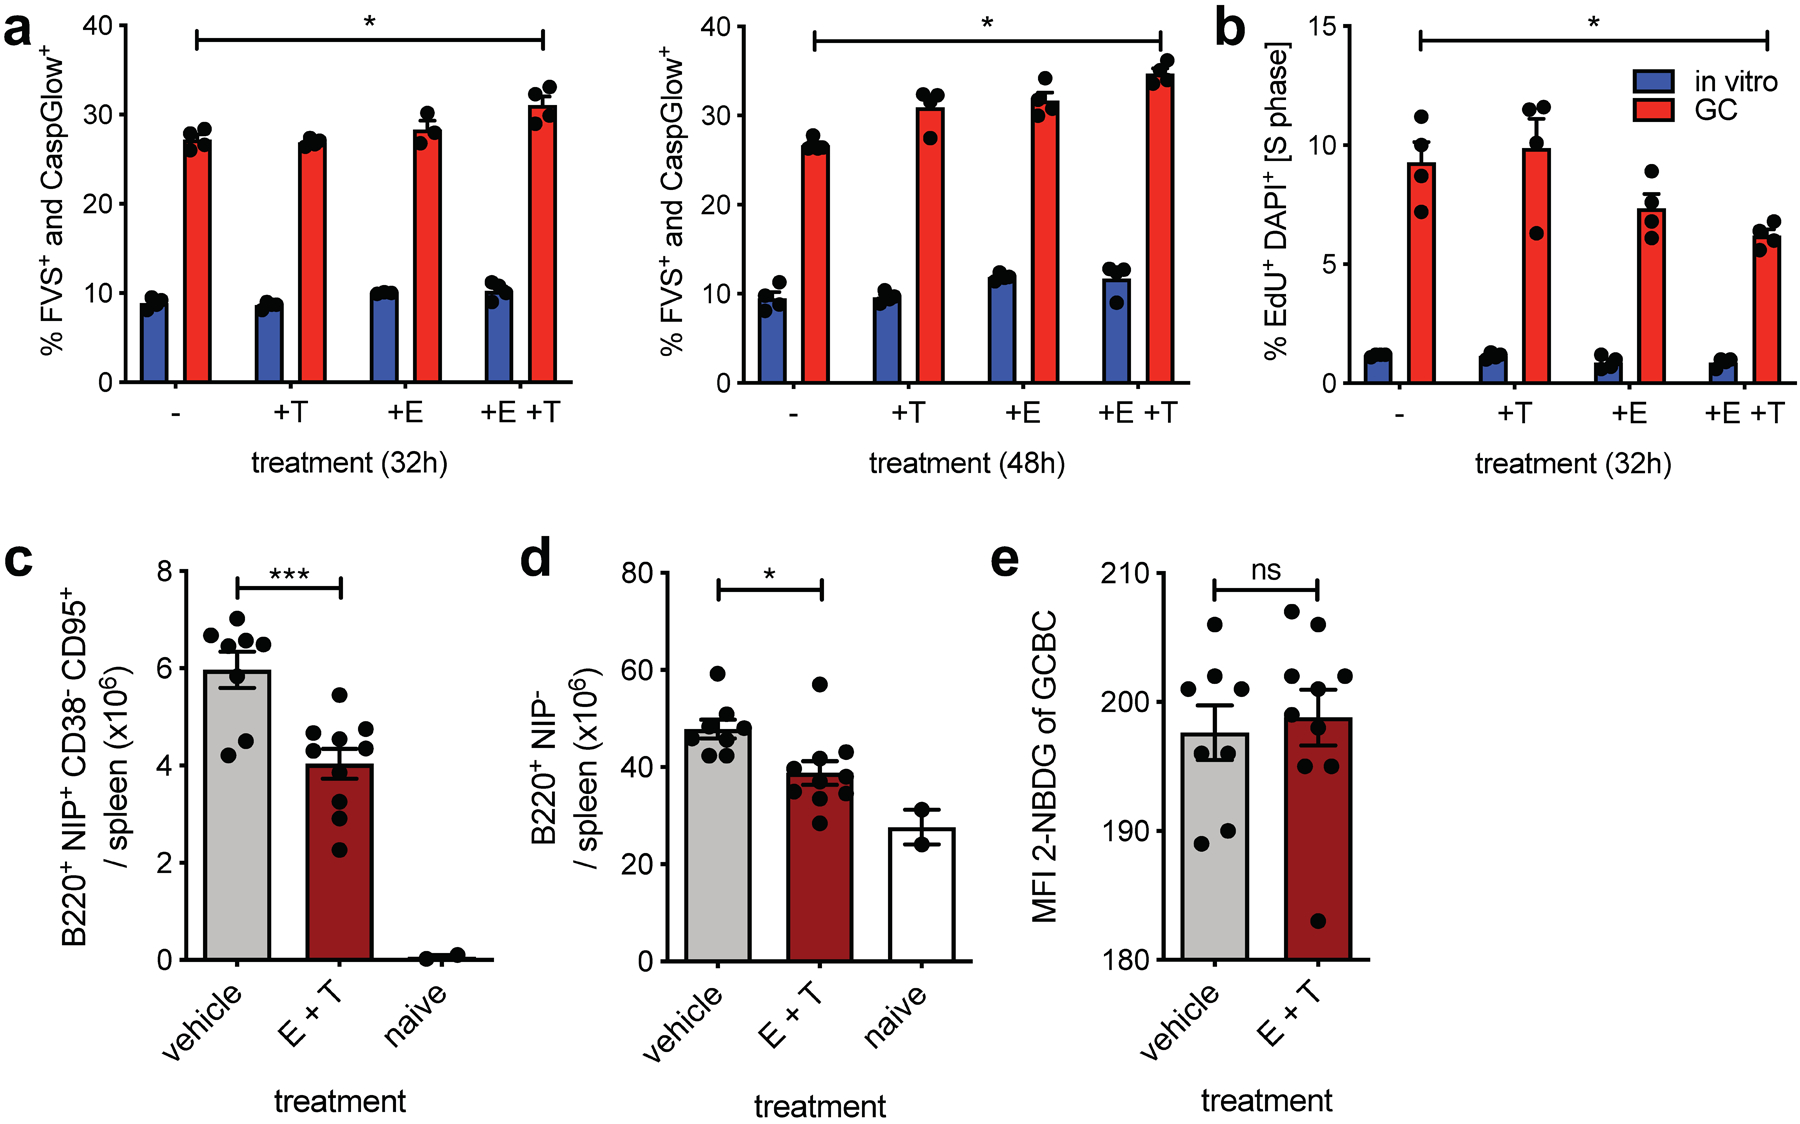
Fig. 5. GCBCs are sensitive to dual mitochondrial and peroxisomal FAO in vitro and in vivo.

a, Tabulated cell death data, measured by flow cytometry as fixable viability stain (FVS) and Caspglow™ positive, from in vitro activated or d13 GCBCs cultured with anti-CD40 in the presence of the indicated inhibitors for the indicated times (n=4). b, Cell cycle analysis of cells treated as in (a) pulsed with 25 μM EdU for 30min prior to harvest (n=4). c, d and e, Absolute number of live splenic NP-specific GCBCs (c), naïve NP− B cells (d) and MFI of 2-NBDG of GCBCs after 30min 2-NBDG in vitro pulse (e) from mice at d14 post NP-CGG immunization given 22mg/kg etomoxir and 11mg/kg thioridazine or vehicle only at d9 and d13 post-immunization. (a) and (b) depict 1 representative of 2 experiments with 4 replicate cultures of indicated samples. GCBCs were pooled from 19 B1–8+/– Balb/c mice at day 14 after NP-CGG immunization and NBC were pooled from 6 unmanipulated B1–8+/– Balb/c mice to generate in vitro activated B cells. (c-d) are from one experiment with two inhibitor doses, which was replicated with an additional in vivo dose in Extended Data Fig. 5; Bars represent mean +/− SEM; *p ≤ 0.05; ***p ≤ 0.001, **** p ≤ 0.0001 by unpaired, two-tailed t-test.
