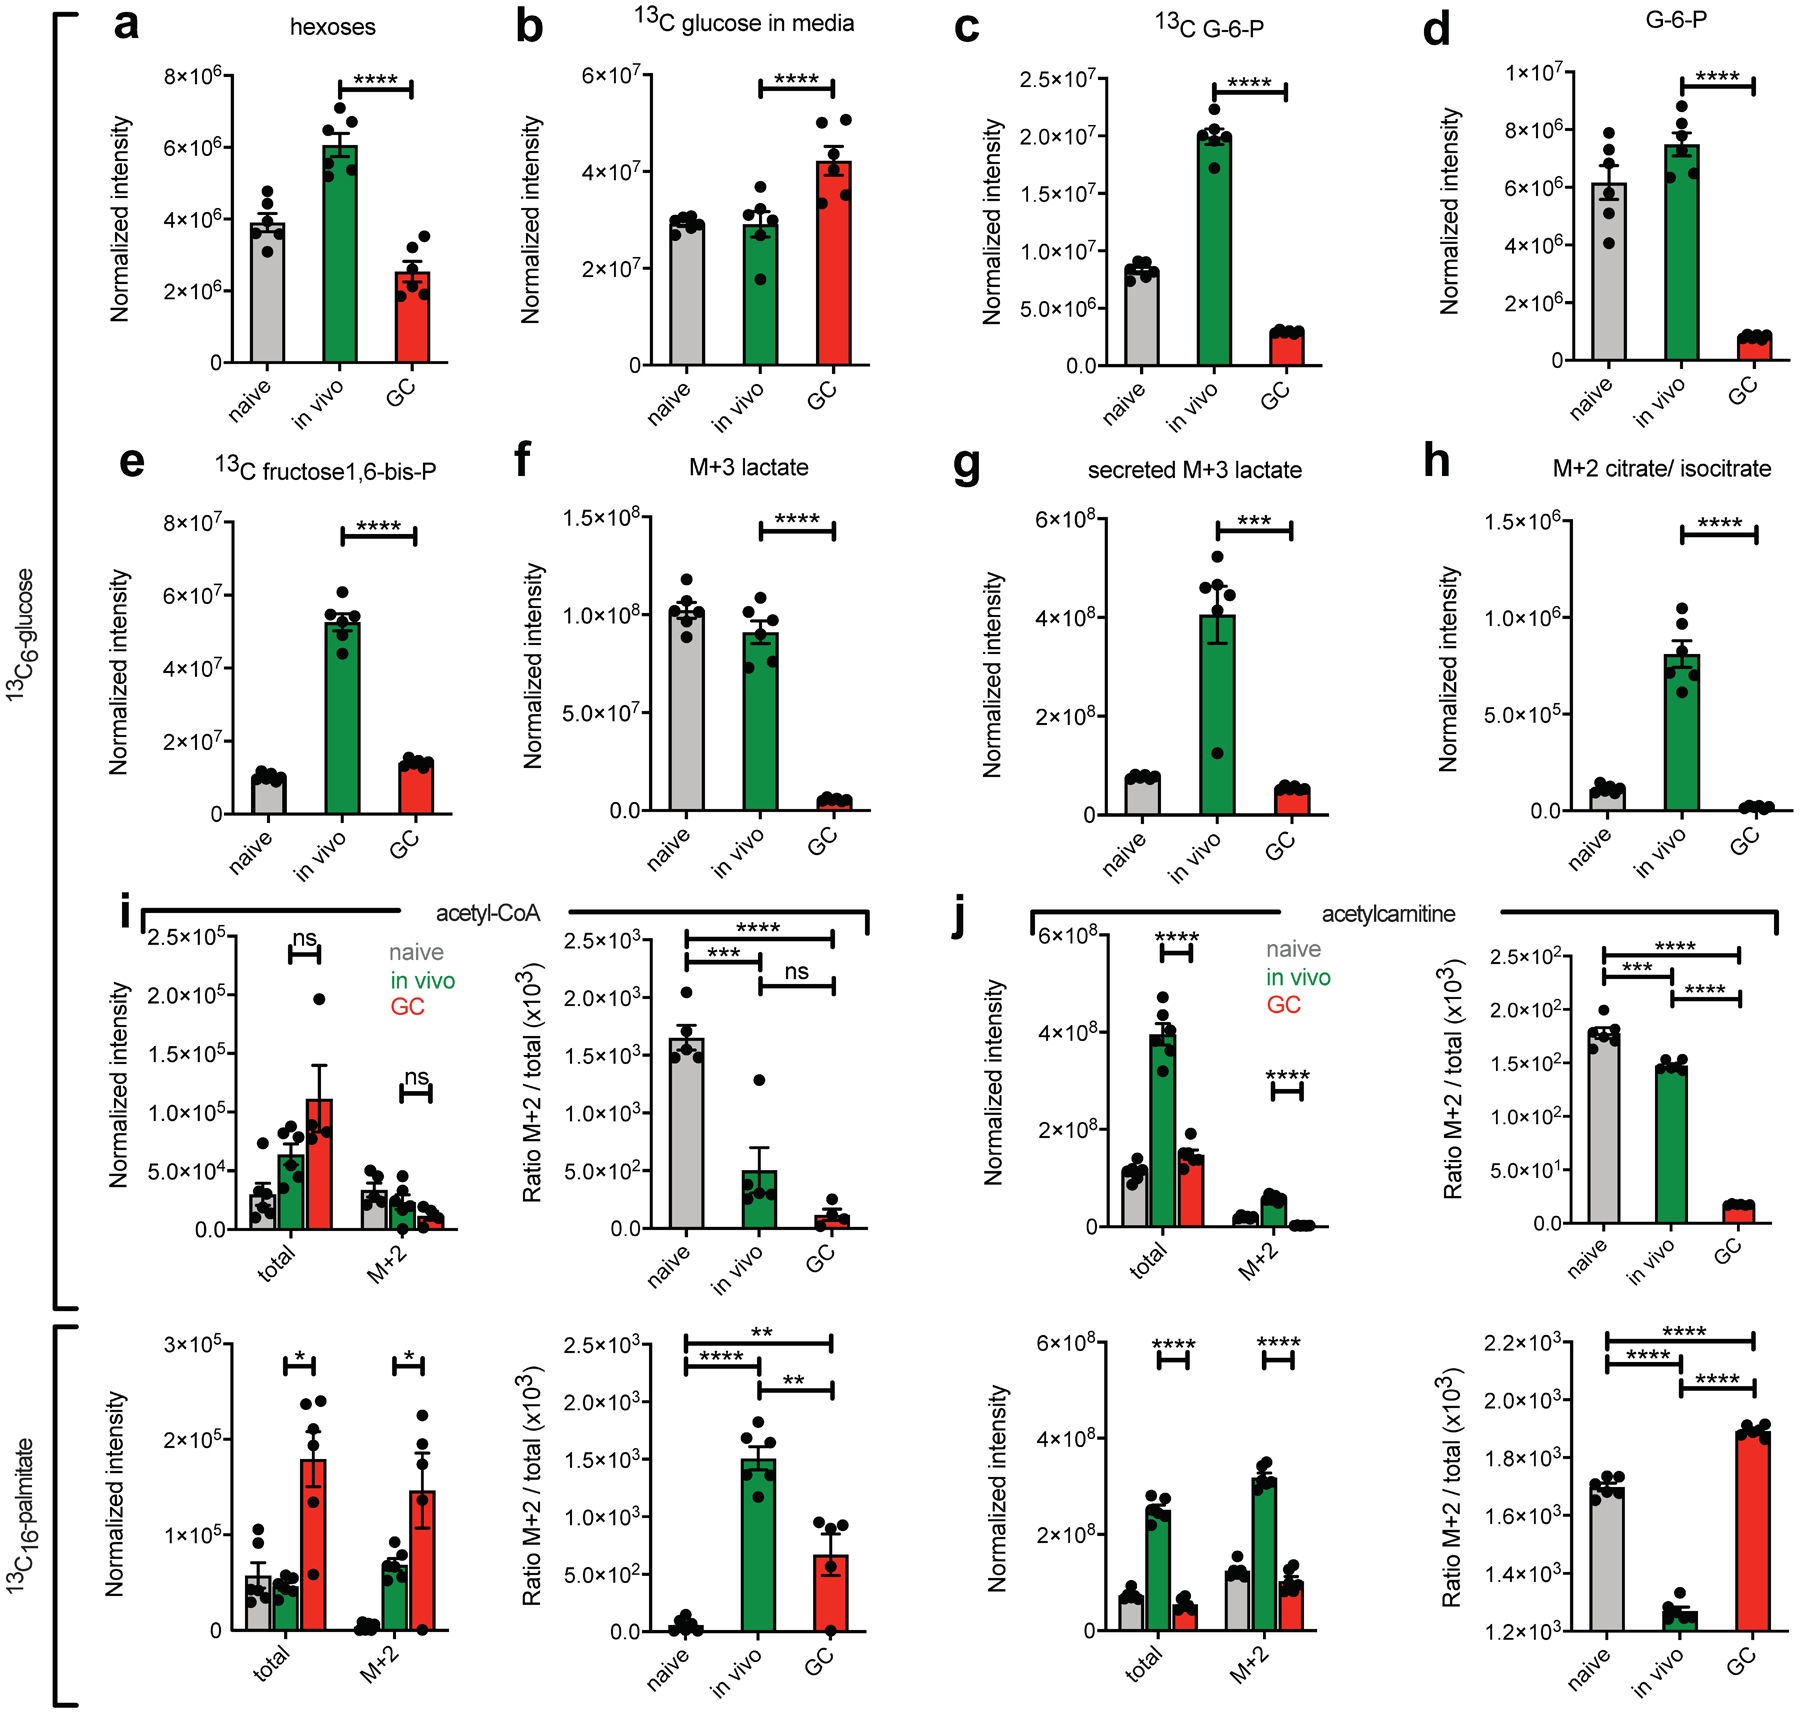
Fig. 6. 13C carbon tracing of glucose and palmitate in cultured B cells by LC-HRMS.

a-j, Bead-purified naive, in vivo activated and GCBCs were cultured in glucose and glutamine free RPMI media with anti-CD40 stimulation to maintain viability. Cells were either exposed to 2mg/ml ([13C6]-glucose (a-h and upper panels of i and j) or 100mM [13C16]-palmitate and 2mg/ml unlabeled glucose (lower panels of i and j) for 4h. Cell lysates (a, c-j) and supernatants (b) were then subjected to LC-HRMS. Shown are normalized intensities (as described in the Methods section) for depicted molecules and ratios of labeled (M+2) to total amounts. Depicted is one representative experiment with n=3–6 per sample. Each n represents a pool of 3 individual wells with 1×10⁶ cells each. Data from an independent experiment are in Extended Data Fig. 6. Bars represent mean +/− SEM. Statistical comparisons are not shown for naïve cells except for ratios in right panels of (i) and (j). *p ≤ 0.05; **p ≤ 0.01; ***p ≤ 0.001; ****p ≤ 0.0001 by unpaired, two-tailed t-test.
