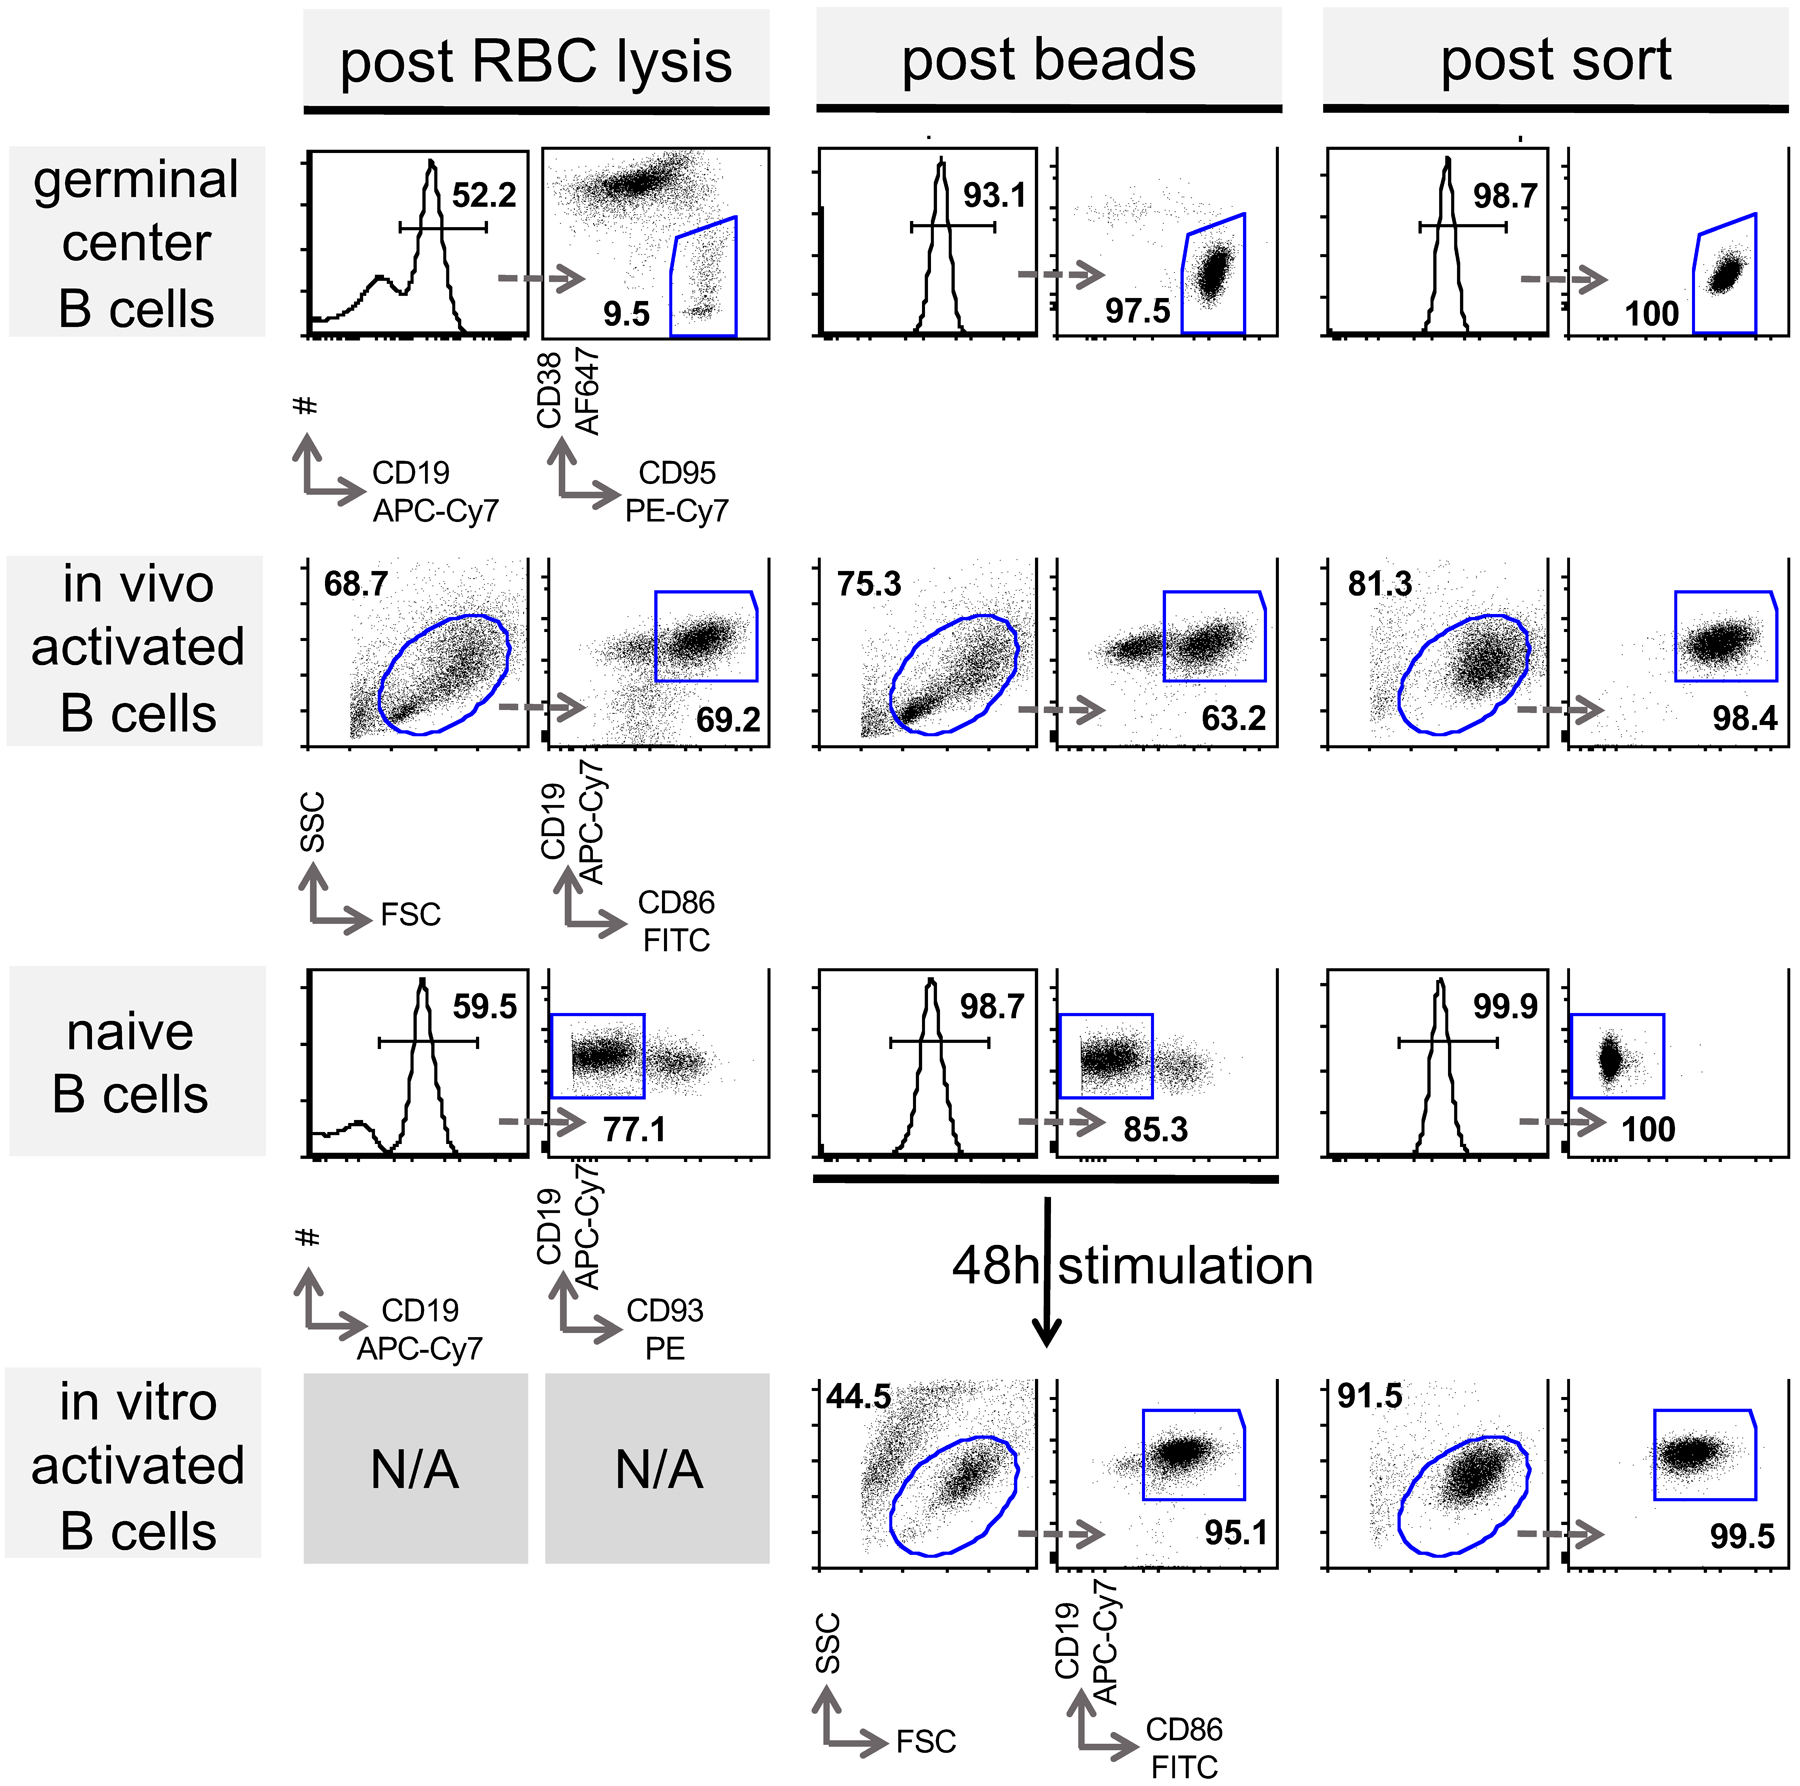
Extended Data Fig. 1. Preparation of B cell populations in support of figures 1, 2, 4, 5, 6, 7 and 8.

Representative FACS plots are shown to determine frequency of indicated target populations (horizontal patterns). Splenocytes were enriched for indicated target population as described in the methods section. After each purification step (columns) cells were subjected to flow cytometric analysis with indicated surface markers to determine purity. Arrows indicate subsequent gating and numbers percent gated population. (RBC; red blood cell)
