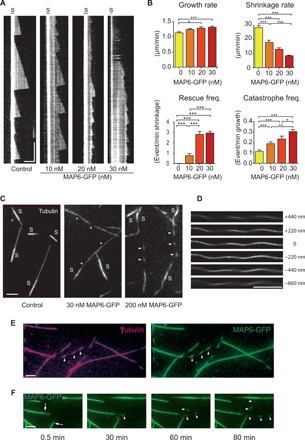
Fig. 2. MAP6 promotes the growth of stable, curved microtubules.

(A) Kymographs show microtubules grown from GMPCPP seeds (S) in the presence of 10 μM tubulin and 0 (control), 10, 20, or 30 nM MAP6-GFP (n = 93, 41, 38, and 40 microtubules, respectively). (B) Graphs show rates of growth and shrinkage and frequencies of rescue and catastrophe, extracted from kymographs presented in (A). (C) Pictures of microtubules grown as in (A) from GMPCPP seeds in the presence of 0 (control), 30, or 200 nM MAP6-GFP for 90 min. Note the modification of microtubule appearance, with increasing concentrations of MAP6, from a straight, uniform conformation (control, left), to a slightly curved shape with portions showing less fluorescence (*, middle), and finally to a dashed line appearance (arrowheads, right). (D) Microtubules grown in the presence of 200 nM MAP6-GFP and imaged using confocal Airyscan. Distance variations in the z axis are indicated to the right. (E) Microtubules first grown with 15 μM tubulin and then incubated with 10 μM tubulin and 150 nM MAP6-GFP for an additional 90 min (arrowheads point to areas of less fluorescence that create a dashed appearance). Magenta, tubulin; green, MAP6-GFP. (F) Time course of microtubule polymerization after addition of 150 nM MAP6-GFP. Preexisting microtubules are polymerized without MAP6-GFP (arrows), and dash-shaped microtubules are polymerized in the presence of MAP6-GFP (arrowheads). Note the rapid binding of MAP6-GFP to preexisting microtubules. Scale bars, 5 μm (horizontal) and 5 min (vertical). Bars, means; error bars, SEM. *P < 0.05; **P < 0.01; ***P < 0.001, Kruskal-Wallis analysis of variance (ANOVA) followed by post hoc Dunn’s multiple comparisons test.
