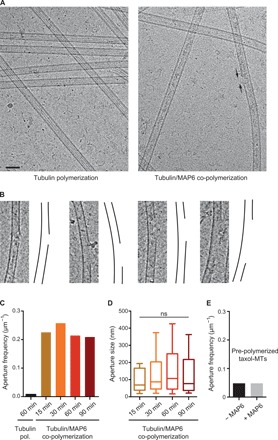
Fig. 4. MAP6 produces apertured microtubules.

(A) Cryo–electron microscopy images of microtubules polymerized with tubulin alone (left) or in the presence of MAP6 (right). Arrows point to one aperture in the microtubule lattice. Scale bar, 50 nm. (B) Examples of apertures observed in microtubules polymerized with MAP6. In each case, the micrograph is on the left, and a drawing of the microtubule wall is on the right. To improve contrast, a band-pass filter was applied and added to original images. (C) Aperture frequency on microtubules polymerized with tubulin alone or in the presence of MAP6 at several polymerization times. The total length of measured microtubules was 370, 164, 291, 569, and 248 μm in the control (no MAP6) and at 15, 30, 60, and 90 min, respectively. (D) Distribution of aperture size in the presence of MAP6 at indicated polymerization times. Whiskers represent the 10th and 90th percentiles of the data. Bars within boxes represent the median. Kruskal-Wallis ANOVA followed by post hoc Dunn’s multiple comparisons test; n = 38, 75, 122, and 52 for assembly at 15, 30, 60, and 90 min, respectively. (E) Aperture frequency in preformed taxol-stabilized microtubules incubated without or with MAP6. The total length of measured microtubules was 319 and 237 μm without and with MAP6, respectively.
