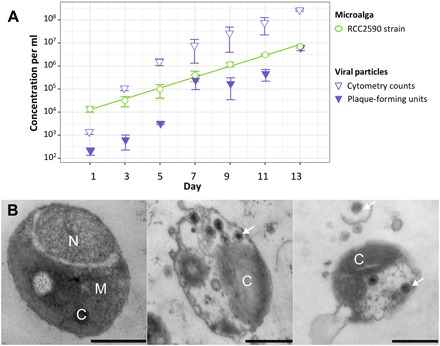
Fig. 1. Population dynamics of the algae and virus.

(A) Population dynamics of microalga (circles) and prasinovirus (triangles) concentrations over 14 days in the O. mediterraneus RCC2590 culture. The line is fitted via ordinary least square regression. (B) Transmission electron micrographs of O. mediterraneus RCC2590 cells from an actively growing culture. The majority of cells have typical morphology (left), while 0.9% of cells contained visible viral particles (middle and right) and free viral particles were observed in the medium aggregated around infected cells (right). Scale bars, 500 nm; C, chloroplast; M, mitochondrion; N, nucleus. White arrows indicate examples of virus particles.
