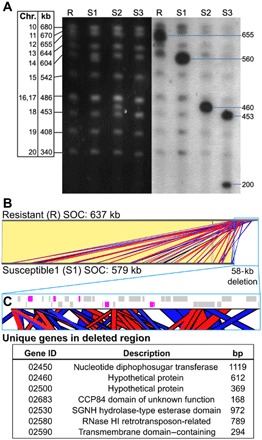
Fig. 2. Comparison of SOC from O. mediterraneus RCC2590 virus-resistant (R) and virus-susceptible (S) lines.

(A) Karyotyping of R and S lines by PFGE (left; black background) and in-gel hybridization with SOC-specific probes (right; gray background). (B) Nucleotide sequence alignment of the SOCs of R and S1 lines shows that they are virtually identical (identical regions linked with yellow blocks) except for a 58-kb deletion at the end of the S1 SOC. The deletion consists of short sequences with significant identity to the rest of the SOC, shown by red and blue blocks denoting sense and antisense matches, respectively. (C) Zoomed-in view of the genomic map of the 58-kb deletion (blue outline). Gray blocks are genes with significant identity to other SOC loci. Magenta blocks show unique genes deleted in the S1 SOC with the table below listing their gene identifiers (prefixed by Ostme30g), putative functional description, and gene length. bp, base pairs; RNase, ribonuclease.
