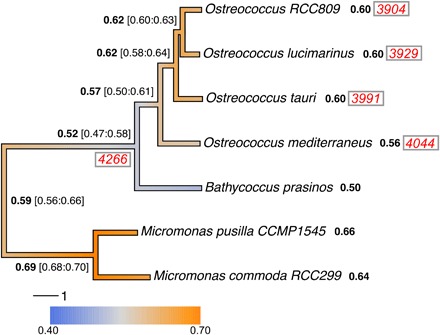
Fig. 4. Phylogeny of fully sequenced Mamiellales genomes, gene family gain and loss, and reconstructed ancestral global GC contents and protein families.

The phylogenetic tree was calculated from random subsampling of 2161 Mamiellales single-copy orthologous gene alignments. The branch colors correspond to the estimated changes in GC over time. The average genome-wide GC contents of extant genomes are shown after the species in bold, and the ancestral estimates are shown at the nodes with ranges in square brackets (see Materials and Methods for the GC evolution estimates). The total number of protein families common to Bathycoccus and Micromonas are shown in red italics between parentheses at the node leading to those genera, and the numbers of those orthologs present in extant Ostreococcus are shown after the species names.
