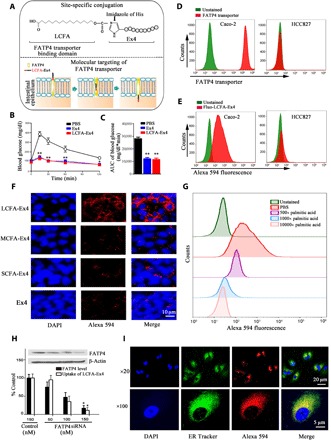
Fig. 1. FATP4 transporter mediates uptake of LCFA-Ex4 in epithelial cells.

(A) Schematic view of chemical structure of LCFA-Ex4 (upper panel) and FATP4-mediated transport of LCFA-Ex4 across intestinal epithelial membrane (bottom panel). (B) Glucose tolerance test in C57BL/6 mice to evaluate bioequivalence between free Ex4 and LCFA-Ex4 after subcutaneous injection (n = 6). (C) AUC (area under the curve) of blood glucose levels in glucose tolerance test. (D) Flow cytometry analysis on FATP4 expression in Caco-2 and HCC827 cells. (E) Uptake of Alexa Fluor 594–labeled LCFA-Ex4 (Alexa 594–LCFA-Ex4) in the FATP4-expressing Caco-2 cells and non–FATP4-expressing HCC827 cells. (F) Microscopic analysis on uptake of Alexa 594–LCFA-Ex4 conjugates [short-chain fatty acid (SCFA), C6; medium-chain fatty acid (MCFA), C10; long-chain fatty acid (LCFA), C16] in Caco-2 cells. (G) Competitive binding to the FATP4 transporter by Alexa 594–LCFA-Ex4 in the presence of increasing concentrations (500, 5000, or 10,000 times) of palmitic acid (C16). (H) Uptake of LCFA-Ex4 in FATP4 knockdown Caco-2 cells. FATP4-specific small interfering RNA (siRNA) oligos were used to knock down FATP4 expression, and a scrambled siRNA served as a control. Inset: Western blot analysis on FATP4 expression. Black bars: normalized FATP4 expression levels; white bars: normalized fluorescence intensity (n = 3). (I) Microscopic analysis on intracellular trafficking of Alexa 594–LCFA-Ex4. Nucleus is in blue, the ER track is in green, and Alexa 594–LCFA-Ex4 is in red. Data are presented as means ± SEM. *P < 0.05, **P < 0.01.
