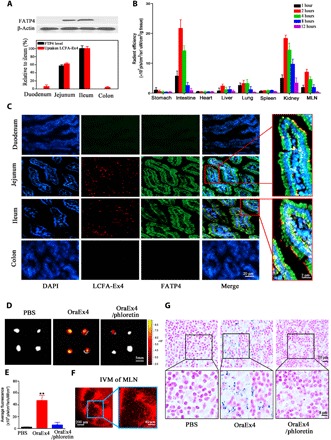
Fig. 3. Biodistribution and lymphatic transport of OraEx4.

(A) Western blot analysis of FATP4 expression in jejunum, ileum, duodenum, and colon and correlation with uptake of LCFA-Ex4 (n = 3). (B) Quantification of fluorescence in major organs at different time points after oral administration of Alexa Fluor 594–labeled OraEx4. All data are normalized to tissue weight (n = 3). (C) LCSM images of Alexa 594–LCFA-Ex4 in different intestinal sections after oral treatment. Representative images are shown. (D) IVIS (In vivo imaging system) images of LCFA-Ex4 in mesenteric lymph node (MLN) from mice treated with OraEx4. (E) Quantitative analysis on fluorescence intensity of LCFA-Ex4 in MLN from (D). (F) Intravital microscopic images of MLN from mice after treatment with OraEx4. (G) Hematoxylin and eosin (H&E) staining of MLN from mice treated with nanogold-conjugated OraEx4 with or without phloretin. Nanogold was stained with silver enhancer. Data are presented as means ± SEM, **P < 0.01.
