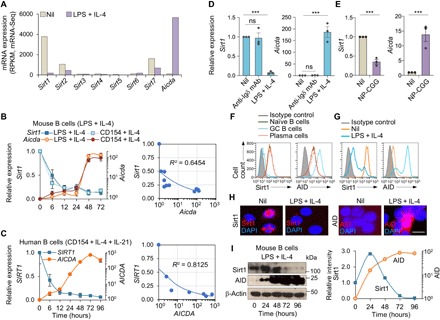
Fig. 1. Aicda-inducing stimuli down-regulate Sirt1 in human and mouse B cells.

(A) Sirt1-7 and Aicda expression in mouse naïve B cells before and after stimulation with LPS plus IL-4 for 72 hours, as measured by mRNA-Seq and depicted as RPKM (reads per kilobase of transcripts per million mapped reads; one of two independent experiments yielding comparable results). (B) Sirt1 and Aicda transcript levels [quantitative reverse transcription polymerase chain reaction (qRT-PCR) analysis] in mouse B cells stimulated with LPS or CD154 plus IL-4 for 0, 6, 12, 24, 48, or 72 hours. Data are ratios to the expression in unstimulated B cells (set as 1; means ± SEM of three biological independent experiments, each consisting of triplicates, left panel). Also shown are the inverse correlation scatter plots of Sirt1 and Aicda expression levels (right). (C) SIRT1 and AICDA expression (qRT-PCR analysis) in human naïve B cells stimulated with CD154 plus IL-4 and IL-21 for 0, 6, 12, 24, 48, 72, or 96 hours. Data are ratio to the expression in unstimulated B cells (set as 1; means ± SEM of three biological independent experiments, each consisting of triplicates, left). Also shown are the inverse correlation scatter plots of SIRT1 and AICDA expression levels (right). (D) Sirt1 and Aicda transcript levels (qRT-PCR analysis) in mouse B cells stimulated with anti-Igδ mAb or LPS plus IL-4 for 72 hours. Data are ratios to the expression in unstimulated B cells (set as 1; means ± SEM of three biological independent experiments, each consisting of triplicates). (E) Sirt1 and Aicda expression (qRT-PCR analysis) in spleen B cells from C57BL/6 mice immunized with nil or NP16-CGG and analyzed 10 days after immunization. Data are ratios to the expression in nonimmunized mice (set as 1; means ± SEM of three biological independent experiments, each consisting of triplicates). (F) Sirt1 and AID protein levels in CD19+IgDhiGL7−CD138− naïve B cells, CD19+IgD−GL7hiCD138− germinal center (GC) B cells, and CD19loCD138hi plasma cells/plasmablasts in C57BL/6 mice immunized with NP16-CGG, as analyzed by flow cytometry 10 days after immunization. (G to I) Sirt1 and AID protein levels in mouse B cells before (nil) and after stimulation with LPS plus IL-4 for 72 hours analyzed by flow cytometry (G), intracellular immunofluorescence (H), and immunoblotting (I). Densitometry quantification of immunoblotting signals normalized to β-actin levels and depicted as ratios of readings in LPS plus IL-4 stimulated B cells to those in unstimulated (0 hours) B cells (I, right). Data in (F) to (I) are one of two independent experiments yielding similar results. ***P < 0.001; ns, not significant, unpaired two-tailed Student’s t test. Scale bar, 5 μm. DAPI, 4′,6-diamidino-2-phenylindole.
