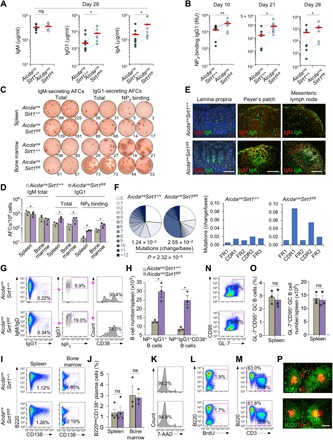
Fig. 3. Activated B cell–specific deletion of residual Sirt1 in AicdacreSirt1fl/fl mice augments the class-switched and hypermutated antibody response.

(A and B) Serum titers of total IgM, IgG1, and IgA (A) and high-affinity NP4-binding IgG1 (B) (ELISA; RU, relative units) in AicdacreSirt1+/+ and AicdacreSirt1fl/fl mouse littermates immunized with NP16-CGG at days 0 and 21 at different time points, as indicated (n = 7 mice in each group). Dotted lines link paired littermates. (C and D) AFCs secreting IgM and IgG1 or NP4-binding IgG1 (ELISPOTs) in the spleen and bone marrow in AicdacreSirt1+/+ and AicdacreSirt1fl/fl mouse littermates euthanized 28 days after the first NP16-CGG injection. Data are one representative of three independent experiments yielding similar results (C) or means ± SEM of three independent experiments (D). (E) Fluorescence microscopy analysis of IgA-producing cells in different gut tissues, as indicated, in AicdacreSirt1+/+ and AicdacreSirt1fl/fl mouse littermates AicdacreSirt1fl/fl mice (one representative of three independent experiments yielding similar results). Scale bars, 50 μm. (F) Overall frequency (change/base) and distribution (pie charts) of point mutations in the V186.2 region of V186.2DJH-Cγ1 complementary DNA (cDNA; pooled data from two mouse pairs) in AicdacreSirt1+/+ and AicdacreSirt1fl/fl mice injected (intraperitoneally) with NP16-CGG at days 0 and 21 and euthanized at day 28. Also depicted by histograms are frequencies of mutations in the framework (FR) and complementarity-determining (CDR) regions (right). P values were calculated by χ2 test. (G and H) Analysis of class-switched IgM−IgD−IgG+ B cells, NP5-binding IgG1+ B cells, and NP5-binding CD38+IgG1+ memory B cells (flow cytometry) in spleen (G) and quantification of these cells in the NP16-CGG immunized mice (H). (I) Flow cytometry analysis of B220lowCD138+ plasmablasts/plasma cells in the spleen and bone marrow. (J) Quantification of proportion of B220lowCD138+ plasmablasts/plasma cells among total spleen and bone marrow cells. (K) Viable (7-AAD−) B cells in the spleen (flow cytometry) of the immunized mice. (L and M) Flow cytometry analysis of proliferating (incorporating BrdU and BrdU+) B cells (L) and proportions of T (CD3+) cells and B (B220+) cells (M). (N) Spleen germinal center (B220+GL7+CD95+) B cells in AicdacreSirt1+/+ and AicdacreSirt1fl/fl mice as analyzed by flow cytometry 10 days after NP-CGG injection. (O) Quantification of the proportion and of B220+GL-7+CD95+ germinal center B cells among total spleen B cells, as analyzed by FACS (left), and total numbers of B220+GL-7+CD95+ germinal center B cells in each spleen (right). (P) Germinal center structure in the spleen (fluorescence microscopy). Data in (G), (I), (K) to (N), and (P) are one representative of three independent experiments yielding similar results. Scale bar, 100 μm. (H), (J), and (O) are means ± SEM of three or four biological independent experiments. *P < 0.05, **P < 0.01, paired two-tailed Student’s t test.
