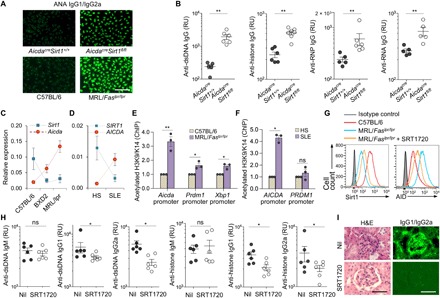
Fig. 6. Sirt1 dampens the lupus autoantibody response.

(A) IgG1+ and IgG2a+ ANAs in sera from 35-week-old female AicdacreSirt1+/+ and AicdacreSirt1fl/fl mice (immunofluorescence microscopy of one representative of three independent experiments). Scale bar, 50 μm. (B) Anti-dsDNA, anti-histone, anti-RNP, and anti-RNA IgG titers (ELISAs) in sera from 35-week-old female AicdacreSirt1+/+ and AicdacreSirt1fl/fl mice (means ± SD of six AicdacreSirt1+/+ and six AicdacreSirt1fl/fl mice, each tested in triplicates). (C) Expression of Sirt1 and Aicda (qRT-PCR analysis) in spleen B cells from C57BL/6 mice and lupus-prone MRL/Faslpr/lpr and BXD2 mice. Data are relative expression to β-Actin (means ± SD of three mice in each group). Dotted lines depict trends. (D) qRT-PCR analysis of expression of SIRT1 and AICDA in B cells from healthy humans and patients with SLE. Data are normalized to expression of β-ACTIN (means ± SD of three healthy individuals and three patients with SLE). Dotted lines depict trends. (E) Acetylated H3K9/K14 in the Aicda, Prdm1, and Xbp1 promoters (ChIP-qPCR analysis) in B cells from C57BL/6 and MRL/Faslpr/lpr mice. Data are ratios of acetylated H3K9/K14 in MRL/Faslpr/lpr mice to that in C57BL/6 mice (set as 1; means ± SD of three mice in each group). (F) Acetylated H3K9/K14 in the AICDA and PRDM1 promoters in B cells from healthy human individuals (HS) and patients with SLE (ChIP-qPCR analysis). Data are ratios of acetylated H3K9/K14 in the AICDA and PRDM1 promoters of B cells from patients with SLE to that of healthy individuals (set as 1; means ± SD of three healthy individuals and three patients with SLE). (G) Intracellular staining of Sirt1 and AID protein levels in spleen B cells from age-matched female C57BL/6 mice, untreated MRL/Faslpr/lpr mice, and MRL/Faslpr/lpr mice treated with SRT1720 (flow cytometry analysis, one representative of three independent experiments). (H) Serum anti-dsDNA and anti-histone IgM, IgG1, and IgG2a titers (ELISAs) in female MRL/Faslpr/lpr mice treated with Nil or SRT1720 (means ± SD of six mice in each group). (I) Photomicrographs of kidney sections from MRL/Faslpr/lpr mice treated with Nil or SRT1720, after hematoxylin and eosin (H&E) staining (left) or fluorescence staining of mouse IgG1/IgG2a (right). One representative of three independent experiments yielding similar results. Scale bars, 100 μm. *P < 0.05, **P < 0.01, unpaired two-tailed Student’s t test.
