
Fig. 3. Effect of candidate ideology on journalist responses.
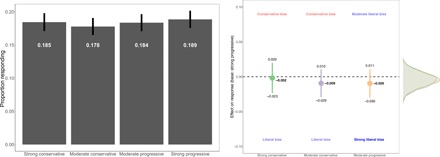
The figure displays raw response rates by treatment condition (left) and the coefficients from a regression that benchmarks the three treatments listed to a strong progressive (right). Bars (left) display mean levels; points (right) are coefficient estimates. Lines surrounding points/bars are 95% confidence intervals. Both are labeled in the figures. The figure also labels the direction of ideological biases in the figure, be they liberal or conservative. The distributions to the right show results from permutation tests that randomly shuffle the data and estimate a treatment effect for each shuffle. The model includes controls for journalist’s position, topical focus, gender, and percent democrat in their constituency, along with state fixed effects. Model N = 13,443.