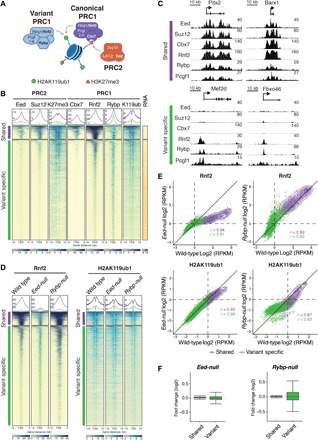
Fig. 1. cPRC1 and vPRC1 partially overlap with PRC2 at silent CGI TSSs in mESCs.

(A) Schematic of core PRC1 and PRC2 complexes and their catalytic activities. Targeting of Cbx7-containing cPRC1 relies on PRC2-mediated H3K27me3. Rybp-containing vPRC1 targeting is H3K27me3 independent. (B) Meta plots and heat maps of Eed, Suz12, H3K27me3 (K27me3), Cbx7, Rnf2, Rybp, and H2AK119ub1 (K119ub) centered around the TSS of CGI promoters (±5 or ±10 kb) show relative enrichment in wild-type mESCs. TSSs are classified by k-means clustering into “shared” (965 TSSs, violet) and “variant-specific” (7333 TSSs, green) and “noBioCap” (19,712 TSSs, not shown). TSSs were grouped by enrichment of cPRC1 (Rnf2, Cbx7), vPRC1 (Rnf2, Rybp), and PRC2 (Eed) subunits, and unmethylated CGIs (BioCap). RNA shows heat map of gene expression measured by QuantSeq. Colored scales (bottom) show dynamic range of ChIP-seq and QuantSeq signals. (C) Genomic screenshots of PcG proteins at representative “shared” and “variant-specific” Polycomb target genes in wild-type mESCs. (D) Meta plots and heat maps compare Rnf2 and H2AK119ub1 enrichments at “shared” and “variant-specific” genes in wild-type, Eed-null, and Rybp-null mESCs. (E) Density scatterplots compare ChIP-seq signals of Rnf2 (±5 kb around TSS) and H2AK119ub1 (±10 kb around TSS) in wild-type and Eed-null mESCs (left) and wild-type and Rybp-null mESCs (right). r, Pearson’s correlation coefficient; “shared” TSSs, violet; “variant-specific” TSSs, green. RPKM, reads per kilobase of transcript per million mapped reads. (F) Box plots show gene expression changes relative to wild type in Eed-null mESCs and Rybp-null mESCs at “shared” (violet) and “variant-specific” (green) genes.
