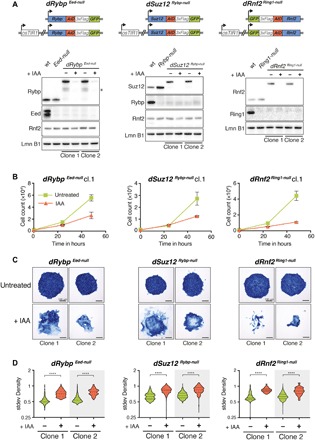
Fig. 2. Combined depletion of Rybp and Eed or Suz12 results in loss of mESC self-renewal.

(A) Schematic representation of degron mESC lines. In Eed-null mESCs, AID-3×FLAG-GFP was inserted biallelic at the 3′ end of the endogenous Rybp ORF (left). In Rybp-null mESCs, AID-3×FLAG-GFP was inserted biallelic at the 3′ end of the endogenous Suz12 ORF (middle). In Ring1-null mESCs, AID-3×FLAG-GFP was inserted biallelic at the 5′ end of the endogenous Rnf2 ORF (right). All degron mESC lines constitutively express osTir1. Western blot of PcG proteins and histone modifications in wild-type, Eed-null mESCs, and two independent clones of dRybp Eed-null mESCs (left). Western blot of PcG proteins and histone modifications in wild-type mESCs, Rybp-null mESCs, and two independent clones of dSuz12 Rybp-null mESCs (middle). Western blot of PcG proteins and histone modifications in wild-type mESCs, Ring1-null mESCs, and two independent clones of dRnf2 Ring1-null mESCs (right). IAA treatment (250 μM) for 24 hours leads to degradation of AID-fusion protein. * indicates unspecific signal. Lamin B1 (Lmn B1) serves as loading control. (B) Proliferation assays of dRybp Eed-null, dSuz12 Rybp-null, and dRnf2 Ring1-null mESCs grown under serum conditions for 72 hours without (untreated) or with 250 μM IAA. Live cells were quantified by flow cytometry every 24 hours. Displayed are the median and SD of four replicate measurements starting at 24 hours IAA (time point, 0 hours). (C) Representative images of alkaline phosphatase (AP) staining of dRybp Eed-null, dSuz12 Rybp-null, and dRnf2 Ring1-null mESC colonies cultured in the absence (untreated) or presence of 250 μM IAA for 5 days. (D) Box plots display SD of density quantifying the degree of mESC colony heterogeneity in response to 5 days of IAA treatment. Statistical significance calculated using unpaired t test (****P < 0.0001).
