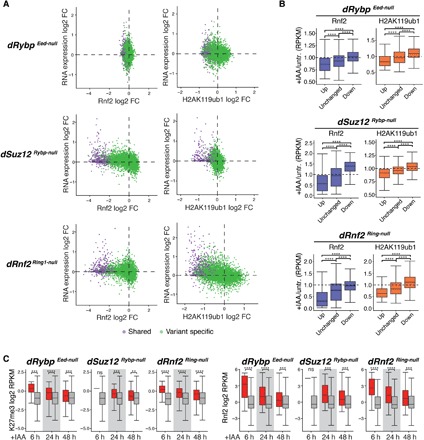
Fig. 5. Polycomb-repressed genes are marked high PRC2, cPRC1, and vPRC1 occupancy.

(A) Scatterplots show changes in Rnf2 (top, ±5 kb around TSS) and in H2AK119ub1 (bottom, ±10 kb around TSS) signals relative to gene expression changes in IAA-treated dRybp Eed-null, dSuz12 Rybp-null, and dRnf2 Ring1-null mESCs. “Shared” genes, violet; “variant-specific” genes, green. (B) Box plots show changes in Rnf2 (±5 kb around TSS) and H2AK119ub1 (±10 kb around TSS) signals of up-regulated (up), unchanged, and down-regulated (down) genes after 48 hours of IAA treatment of dRybp Eed-null, dSuz12 Rybp-null, and dRnf2 Ring1-null mESCs. Significance (P value) calculated using Wilcoxon test (****P < 2.2 × 10⁻¹⁶). (C) Box plots display wild-type levels of H3K27me3 (±10 kb around TSS) and Rnf2 (±5 kb around TSS) of genes up-regulated (red) or unchanged (gray) at 6, 24, and 48 hours of IAA treatment of dRybp Eed-null, dSuz12 Rybp-null, and dRnf2 Ring1-null mESCs. Significance (P value) calculated using Wilcoxon test (**P < 0.01; ***P < 0.001; ****P < 1 × 10⁻⁴; ns, not significant).
