
Fig. 3.
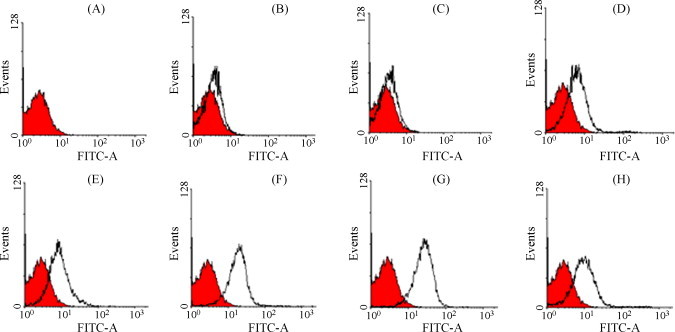
Flow cytometry analysis of cells that expressed WNV E proteins. The profile of transfected 293T cells without antibody staining was used to define the background of fluorescent intensity (A–H, red). The white profiles in (B–H) were compared with reference to the red profile. (B) Stained directly with FITC-conjugated anti-mouse IgG, without addition of primary antibody; (C) stained with normal mouse serum; (D–H) stained with H5, 6A11, 4B3, 2F5 and 6H7, respectively. (For interpretation of the references to color in this figure legend, the reader is referred to the web version of the article.)