
Fig. 2.
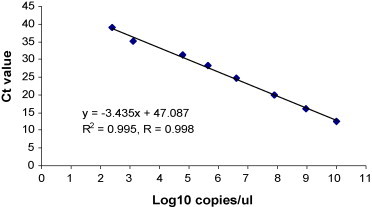
Standard curve of real-time RT-PCR (RRT-PCR) assay for turkey coronavirus (TCoV). The X-axis shows the concentration of serially diluted RNA in vitro transcribed from standard pTriEx3-6F/6R in log 10 value and the Y-axis indicates the corresponding threshold cycle (Ct) value. The linear quantitative correlation was established from 102 to 1010 copies/μl with 99.8% coefficient. The detection limit is as low as 102 copies/μl.